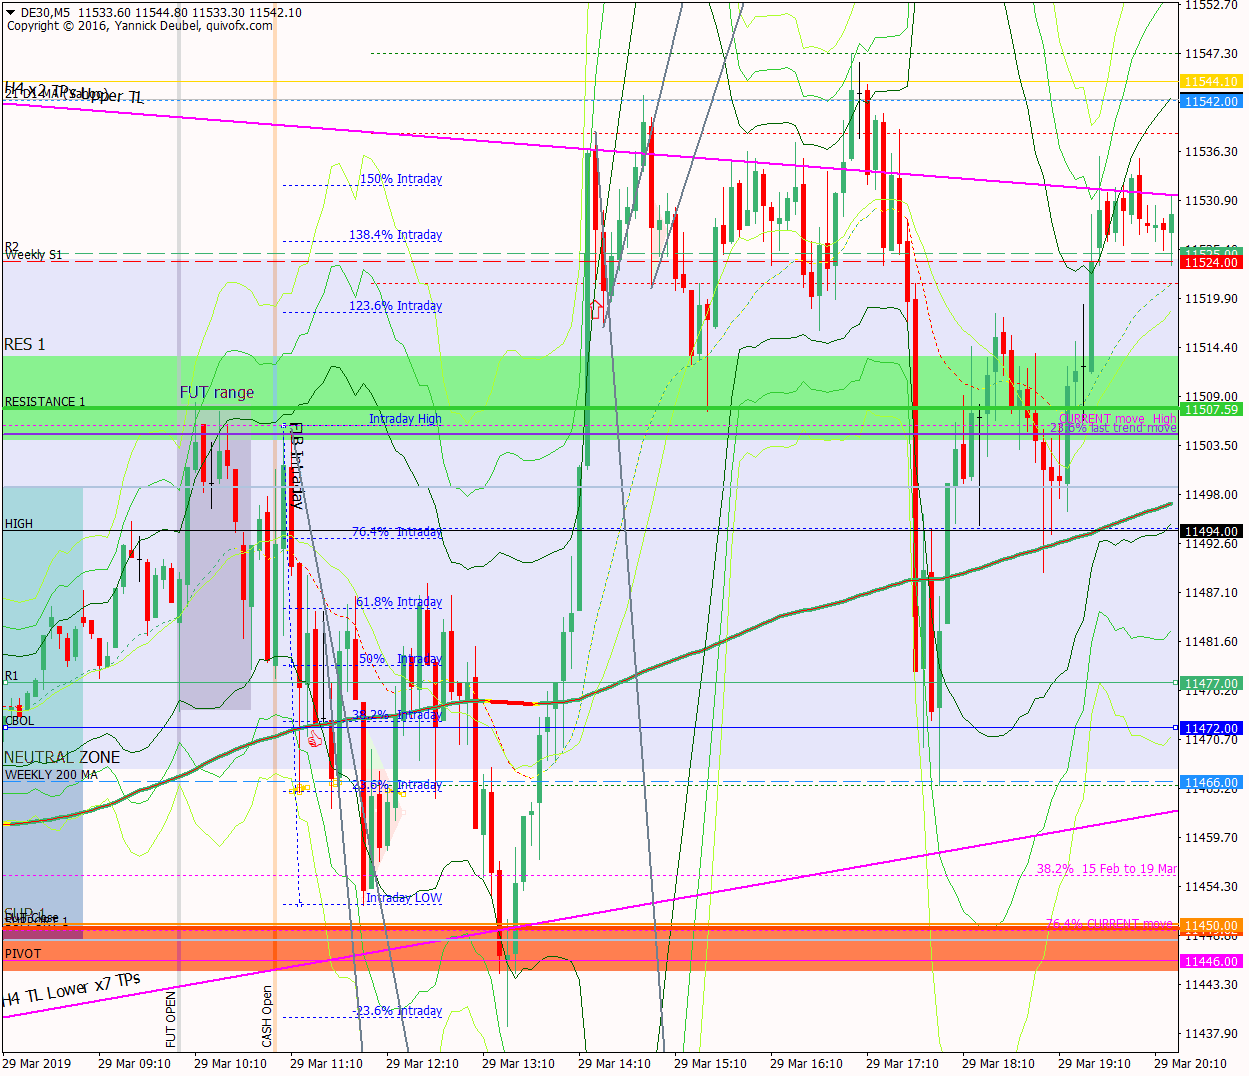
29 Mar – Tests the supporting TL then breaks above 11500 to daily 21MA
29 March 2019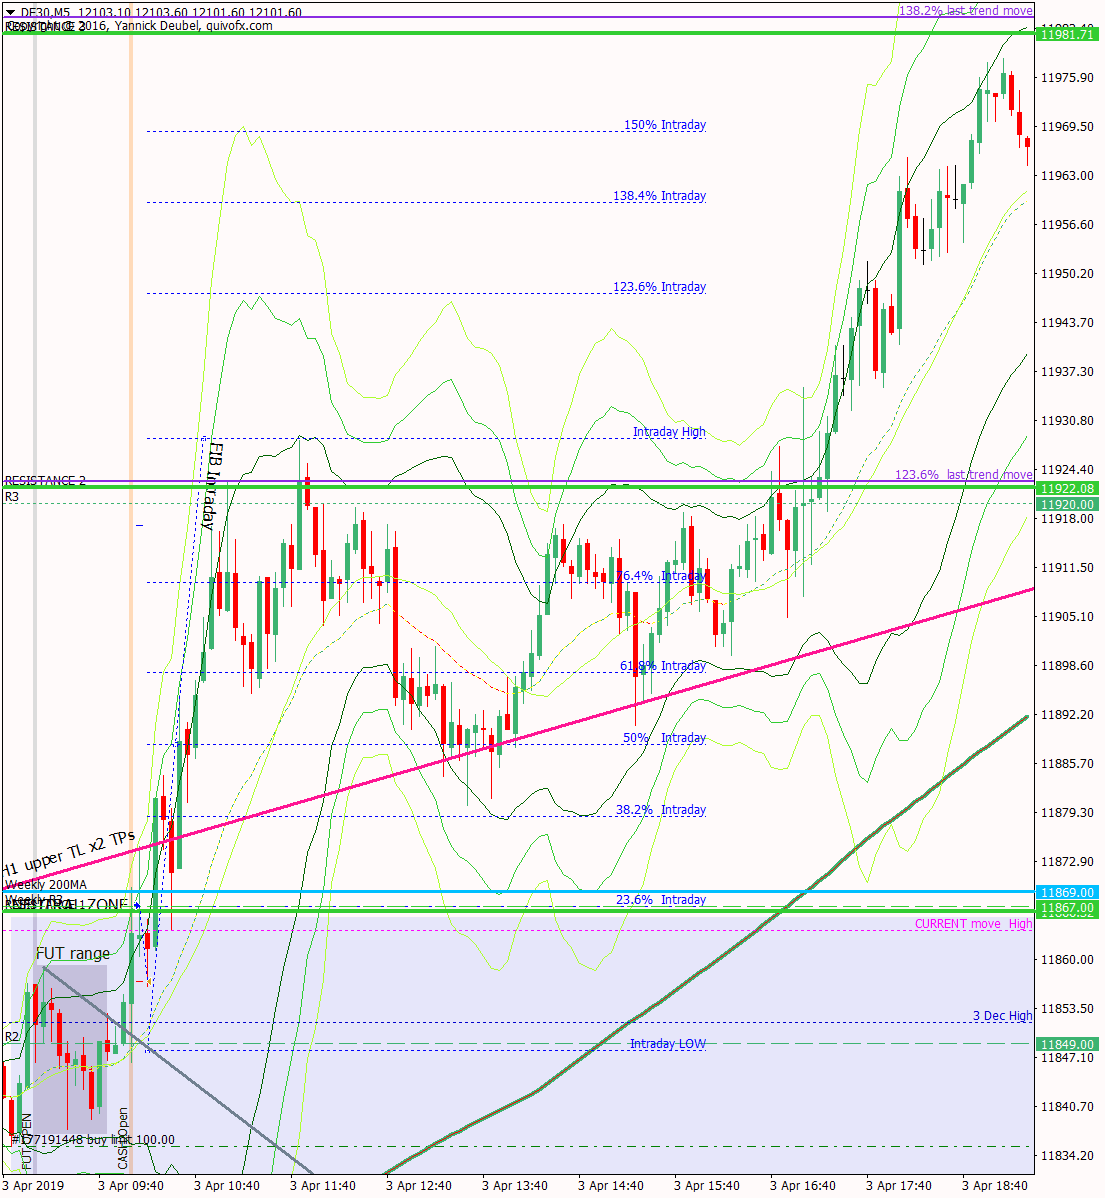
3 Apr – Up trend continues and is unphased by weekly 200 MA
3 April 2019Pre-open scenarios
Last week was predominantly bullish – and the failed bear bar on 28th Mar gave a nice buy signal. But where are we now? It’s the first trading day of the month, so that can be a good trending day and could be bullish as new money come in. But looking at the daily chart, a reversal from here would make the right shoulder of a head and shoulders pattern. On the other hand, the daily 200MA is now easily within site at 11723, so this will be a target today.


Futures opened at 11628, leaving a gap of +103pts against the cash close and 86 against the futures close. The futures open created an ex-gap of 79 pts against Friday’s close.
Physical/body
Sleep – what time did I go to bed? 23:15 so 7.5hrs
How much coffee have I had? Half a Alu pot
How do I feel? Good – trading is just the thorn to take out the other thorns.
H4 and H1 charts from the morning futures session


Time stamp: 8:26, bullish
Scenario 1: goes down to fill ex gap at 11549 and then reverses for 11730ish for 200MA
Scenario 2: LOD is 11600ish as it fills gaps from 20th March and then trends up all day to 11730 and beyond – nearly spot-on high was 11705 on IC
Scenario 3: fills all gaps and ranges all day but doesn’t excced the futures high at 11642
One issue today is that the levels between 11600 and the cash gap fill down at 11526 is that the levels are very spread out – appearing at intervals of 10pts – this can make trading with 10pt stops quite a headache.
What the market looked like at the end of the session

PA during my trading hours

Key points about today's PA and setups that worked
Today was a big up day and the market closed on the highs at 11685 – according to Yahoo – but on my chart the high was 11705
- the futures opened at 11628 and the cash low was 11603 so 100pts was actually available to day despites the market’s 150pt climb
- the market was trending but also respecting levels so the 3Min Bolli shorts worked today from the first RES level
- from there it retraced fairly precisely to intraday fib levels and created triangles at each retrace
- the market made a steady climb to 11705, pausing at a fib level and previous major swing low
- hitting 11705 triggered a sell off down to the futures open price and resistance-turned-support at 11628
- since then, during the US session, it has recovered 11700
How effective was my Neutral Zone? The upper bound was spot on as it produced two 3Min Bolli trades – one BE and one 2:1; the break above the level produced a 5:1 trade. The lower level wasn’t in play.
How precise were my levels? SUP 1 would have been the trade of the day but it was a few points too low; RES 1 as a line was spot on and so was RES 2 (I won’t use Zones instead of levels again unless it’s absolutely essential as they just confuse me and trigger over trading)
What I did

TOTAL =-0.4R | # Trades 19 | Winners 4 | BE 2
Average R per winner = 3 | Losses > 1R = 0 | Scratched (loss<1R) = 2
R-multiples: trades 2:1 or more = x | trades 5:1or more = x
Outcome using standard TP strategy and same trades
2:1 trades (4R) + 5:1 trades (3 x 2.5R) + BE (0R) + Losses (-11R) = +0.5R
My results vs. SYS = -0.9R
ON TILT trade = x (xxR)
Today's most gorgeous setup
This was the 3Min Bolli at RES 2, and it was a simple trade that needs no further explanation. With only two bars before the reversal began, it was hard to get a 3Min Bolli 2nd chance trade, but a nice Imp-Corr structure formed at the Feb 6 Low, which would have been a good place to add.

For reference: 6 month cash chart at COB yesterday


