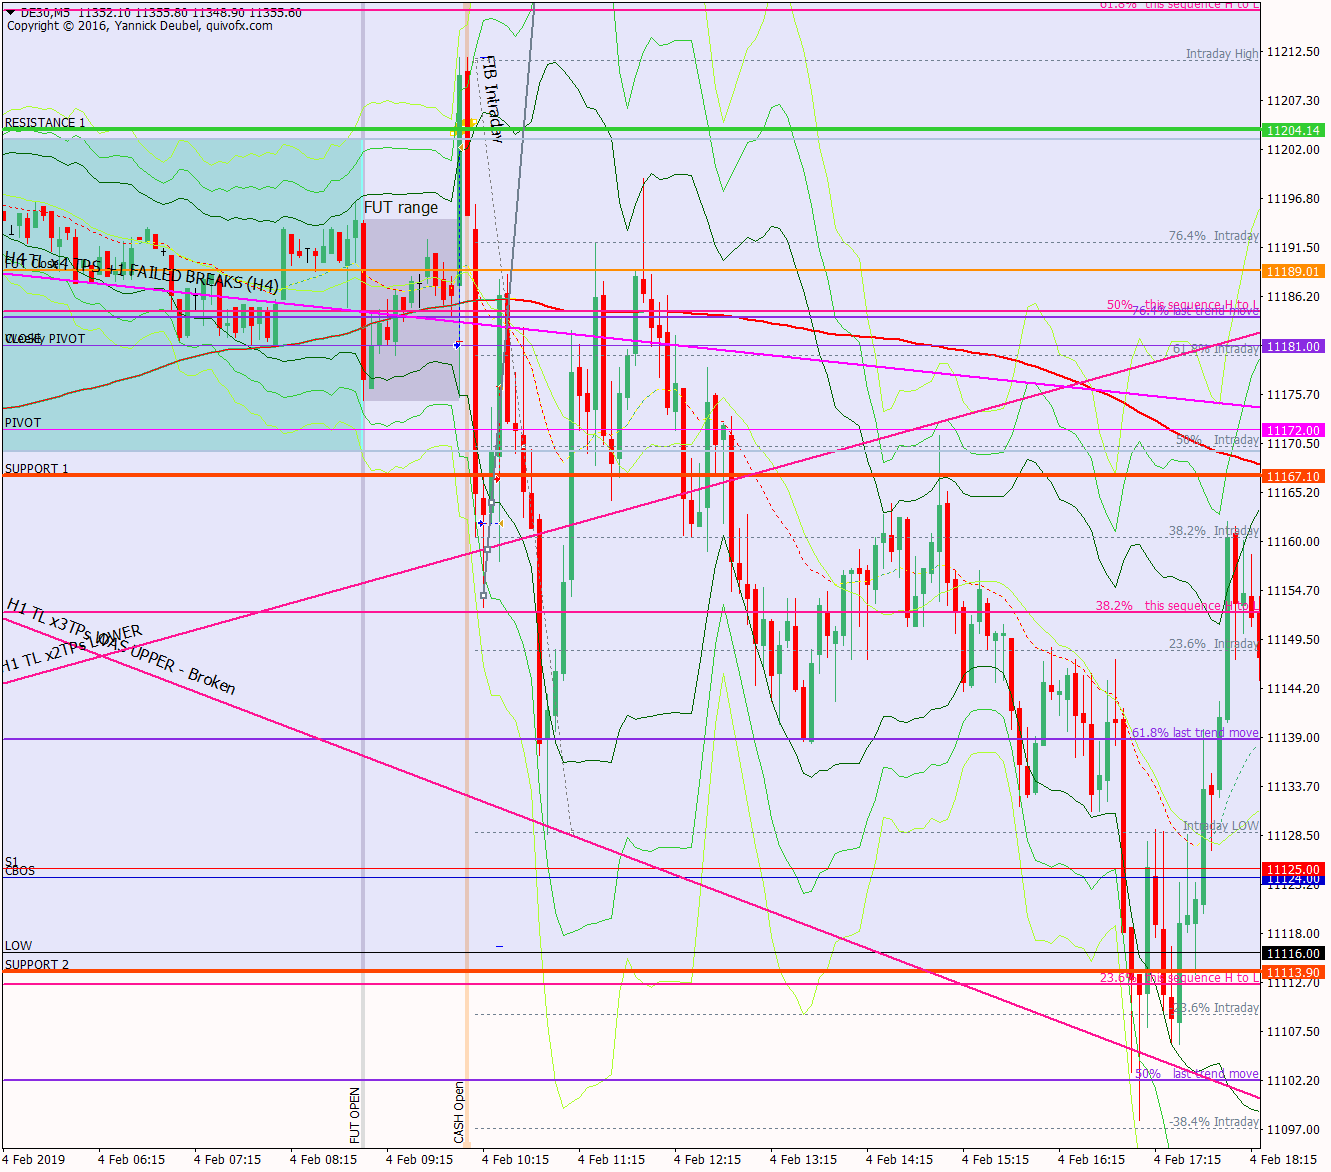
4 Feb – Breaks supporting TL but reverses straight back up again
4 February 2019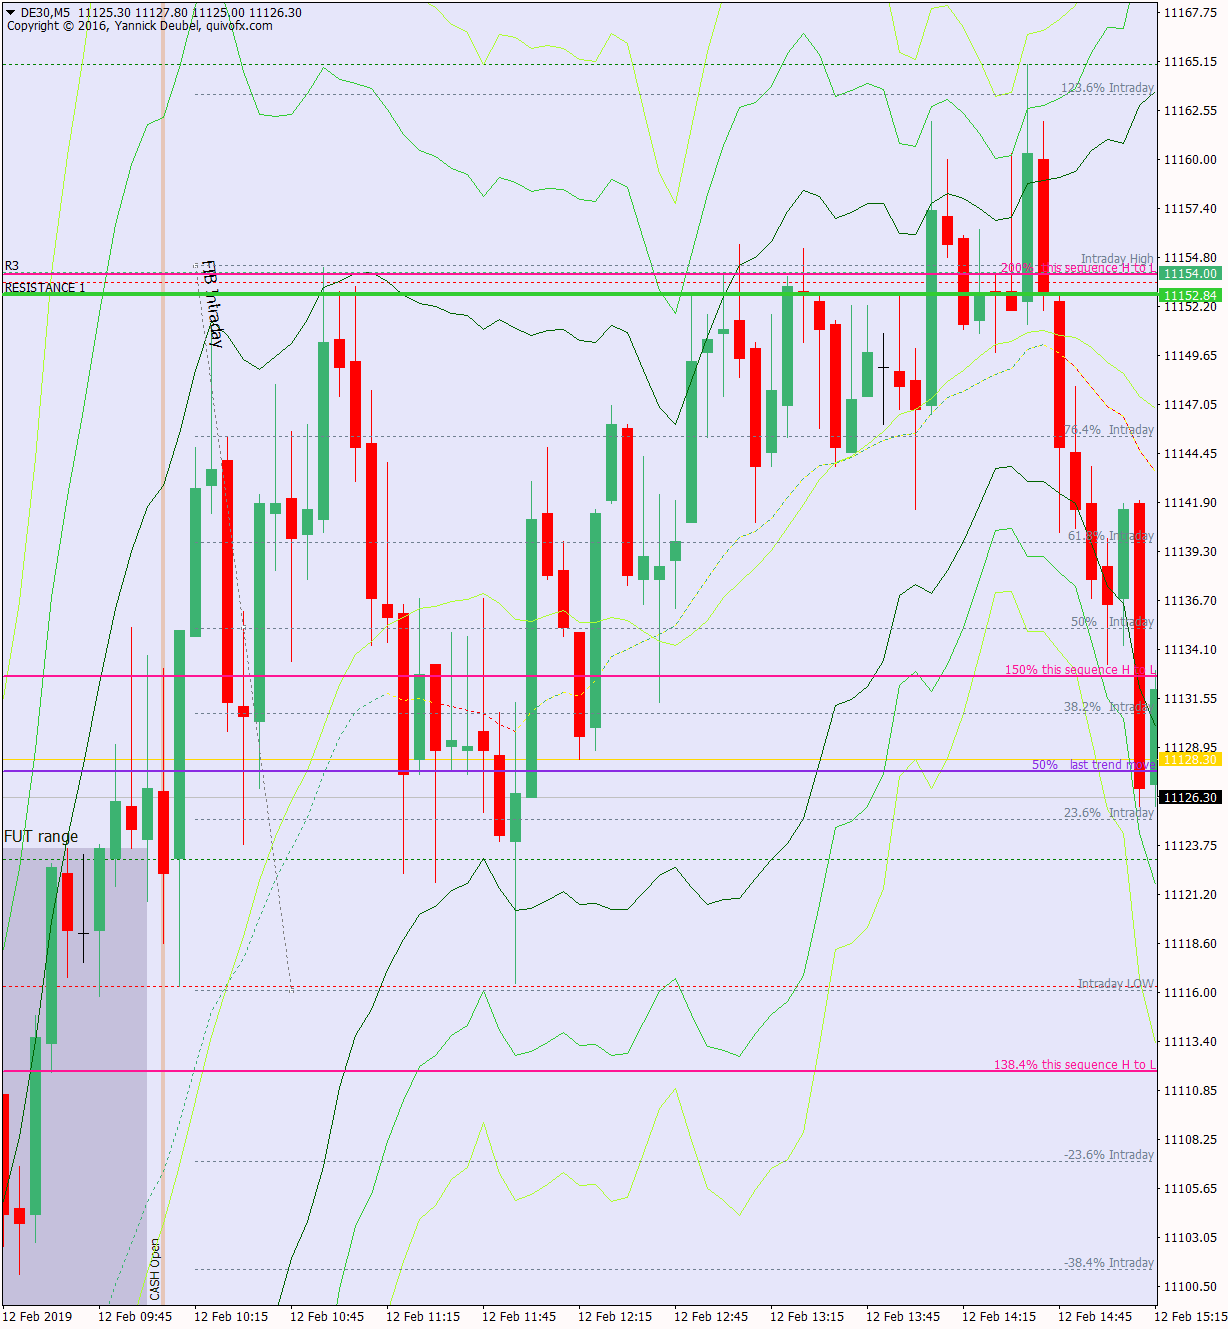
12 Feb – 50pt damp squib range between cash chart 21 MA and R3
12 February 2019Pre-open Scenarios
The move that began on 6th Feb has slowed down. There was a big buy-in on Friday from 10868, followed by a strong US session and then a backwards and forwards ON session. 11000 will be critical today with CBOL just above it at 11007, and above that is Friday’s high at 11045. However, despite all these obvious levels and the BNR, we also have the cash chart 50MA at 10982 and acceptance above or below will define the current trend as up or down – or neutral if price just vibrates around it and makes no headway in either direction.
Futures opened at 10961, little changed from where they closed on Friday, but leaving a cash gap up of 54pts.
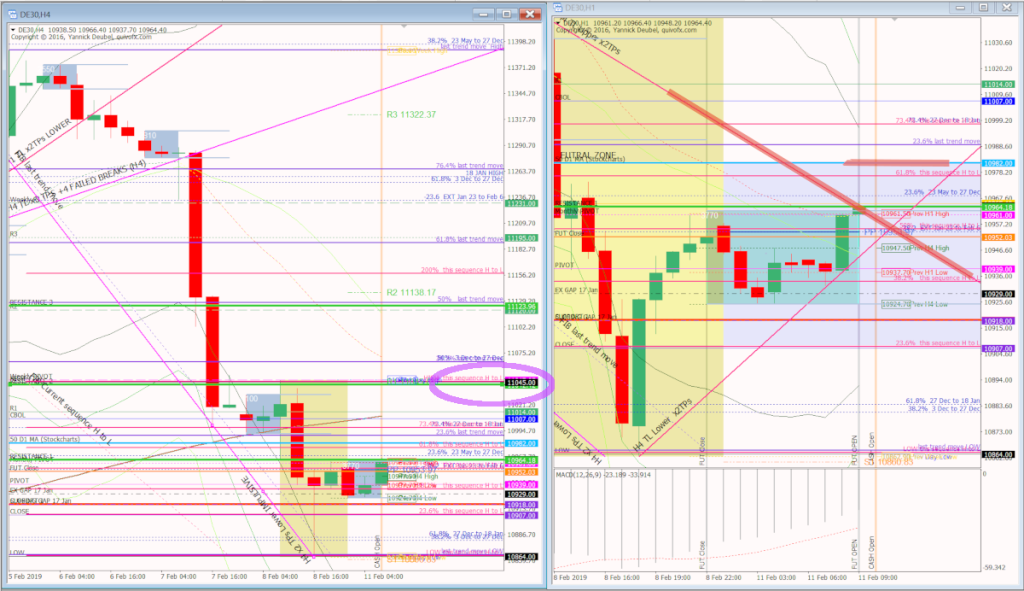
H4 and H1 charts from morning futures session
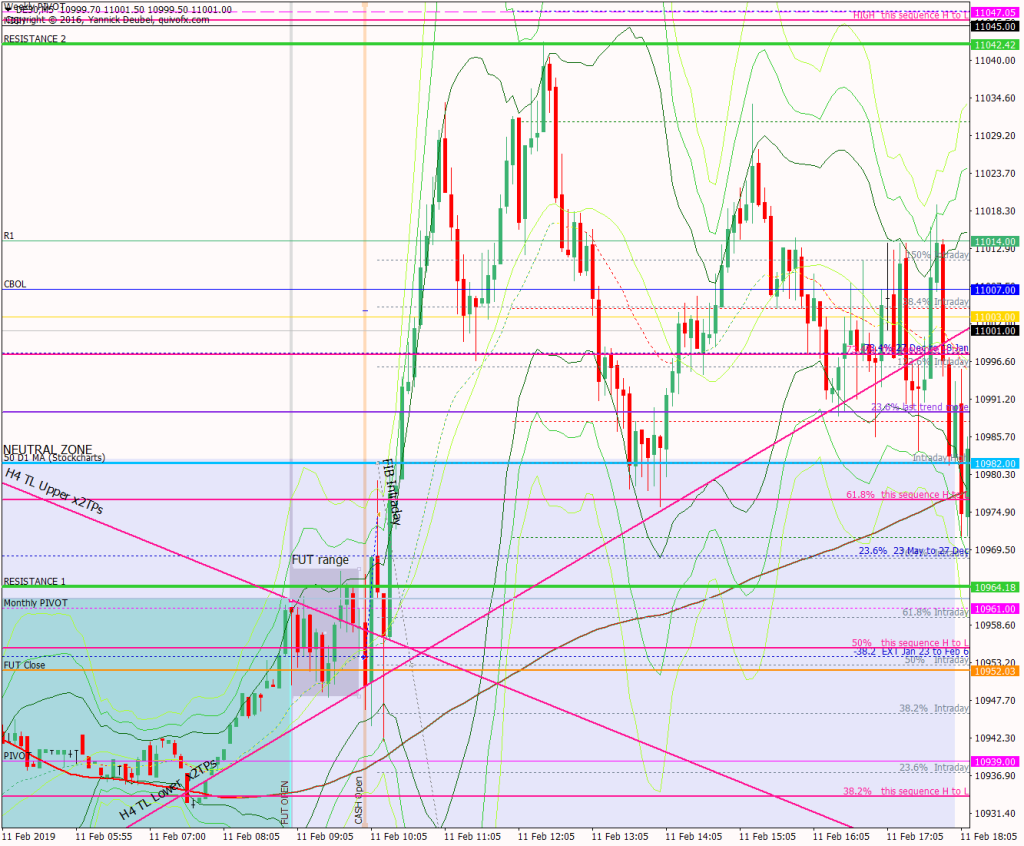
Whatt the market looked like at the end of the day
Key points about today’s PA and setups that worked
The monthly pivot capped prices during the futures session and the futures session high gave me my RES 1 level.
- at the open, price moved down to the confluence area of 169 (M3), futures gap and towards the pivot and then made a rapid reversal
- it powered straight through the daily cash chart 50MA and then straight through CBOL and R1, clearly indicating a trending market
- the next major level was Friday’s high at 11045, which also fitted in with fib levels and this is where the market reversed
- after retesting the 11050 level and getting rejected, it headed back down to the 50MA from where it bounced to a lower high.
How effective was my Neutral Zone? The upper bound was at the 50MA and this worked beautifully as a break for 50 to 60pts and then later on as a retest level; the lower bound was not in play.
How precise were my levels? RES 1 was not tradeable although a break of it did set the direction early on. RES 2 was spot on.
What I did
TOTAL = 6.8R | # Trades 7 | Winners 4 | BE 1
Average R per winner 2.2 | Losses > 1R 0
R-multiples: trades 2:1 or more 4 | trades 5:1or more 2
Outcome using standard TP strategy and same trades:
(STE at 1:1 50% off at +20 and 50% off at +50)
2R (2 x 2:1 trades) + 7R (2 x 5:1 trades) – 2R (losses) = 7R
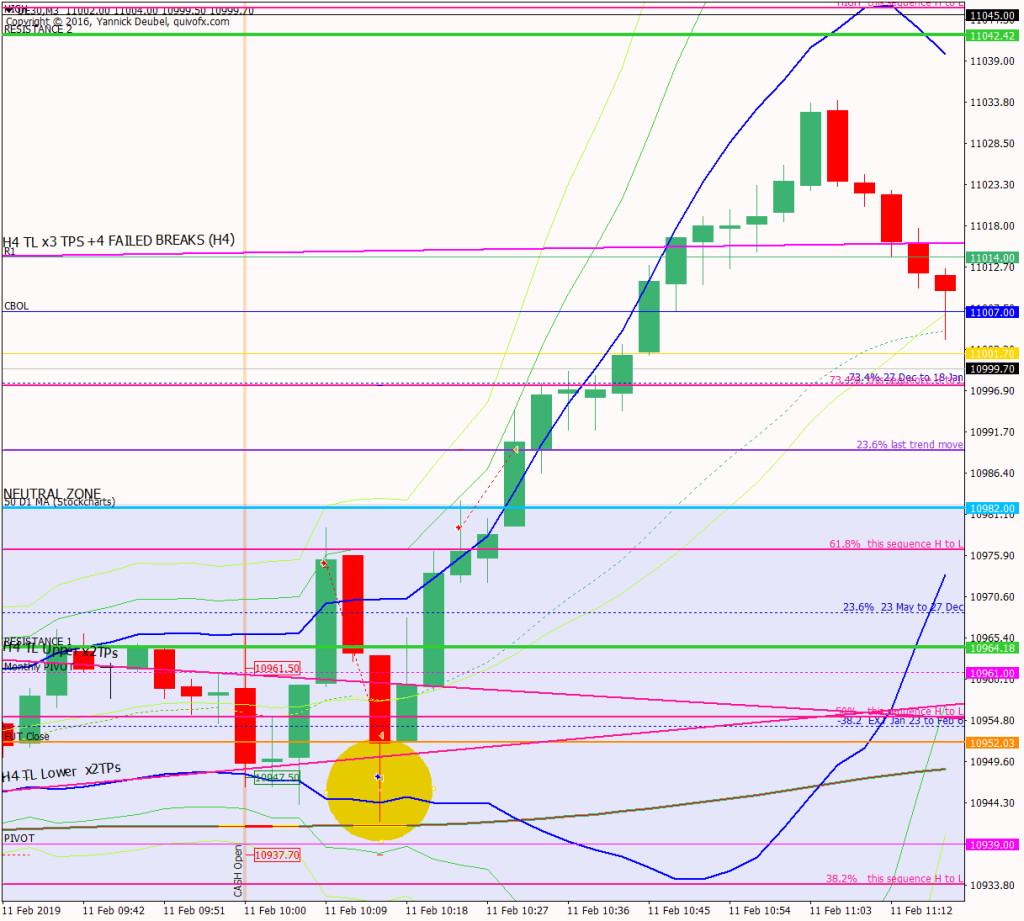
Today’s most gorgeous setup
Buy at the 3Min 169 outside the Bolli Bands – with the futures gap close there too, and the pivot just below, this was also an area of confluence, adding weight to the probability of a positive outcome. This turned out to be a 7R trade.
With such strong confulence, it would have been worth making two attempts at this trade if the first failed.
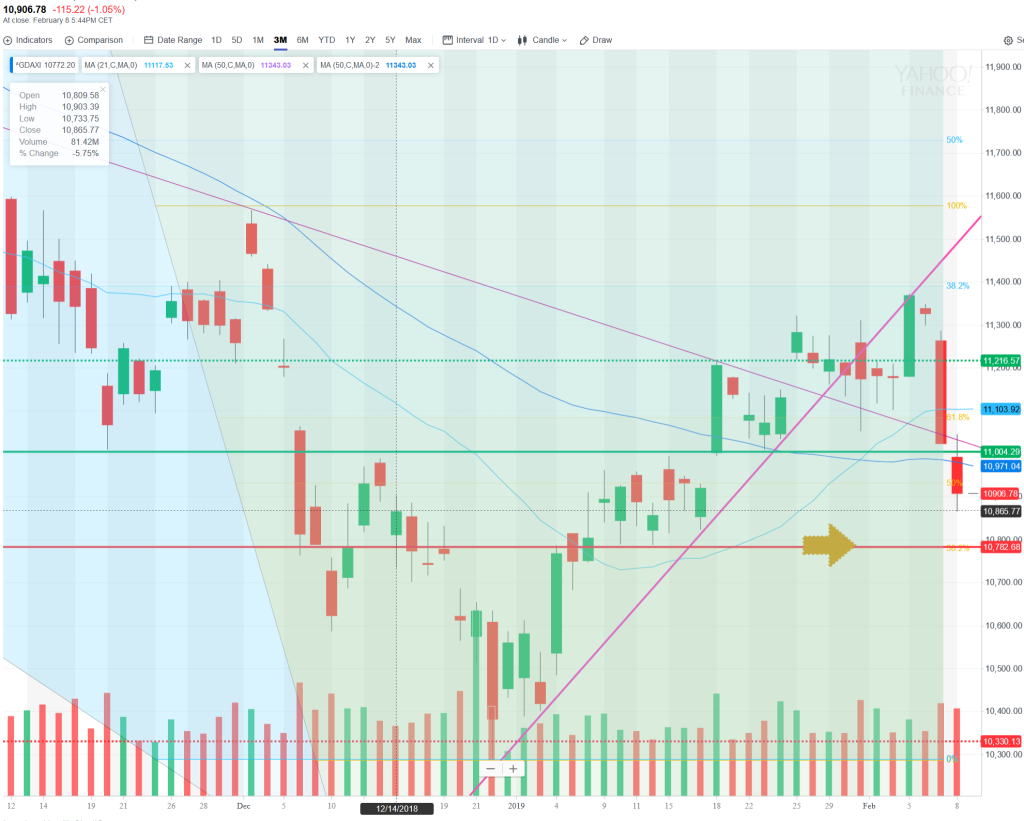
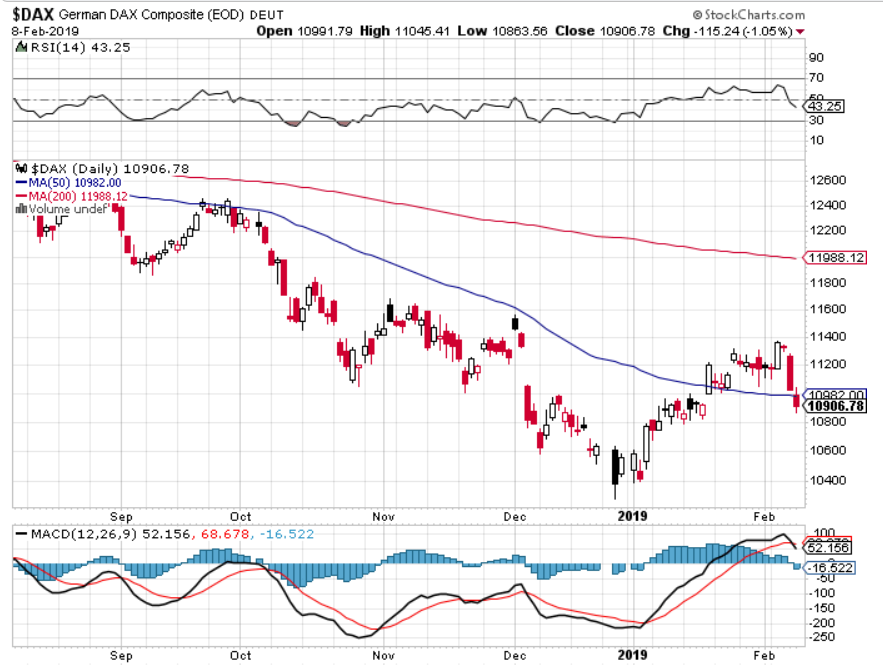
For reference: 6 month cash chart at COB yesterday


