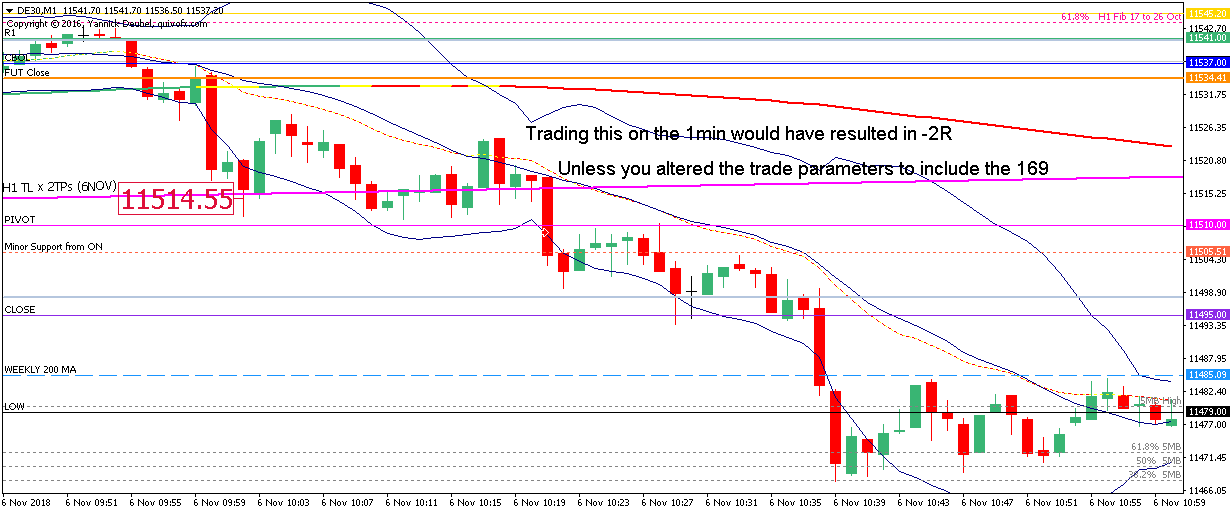
6 Nov – TL breaks for +80 but reverses again
6 November 2018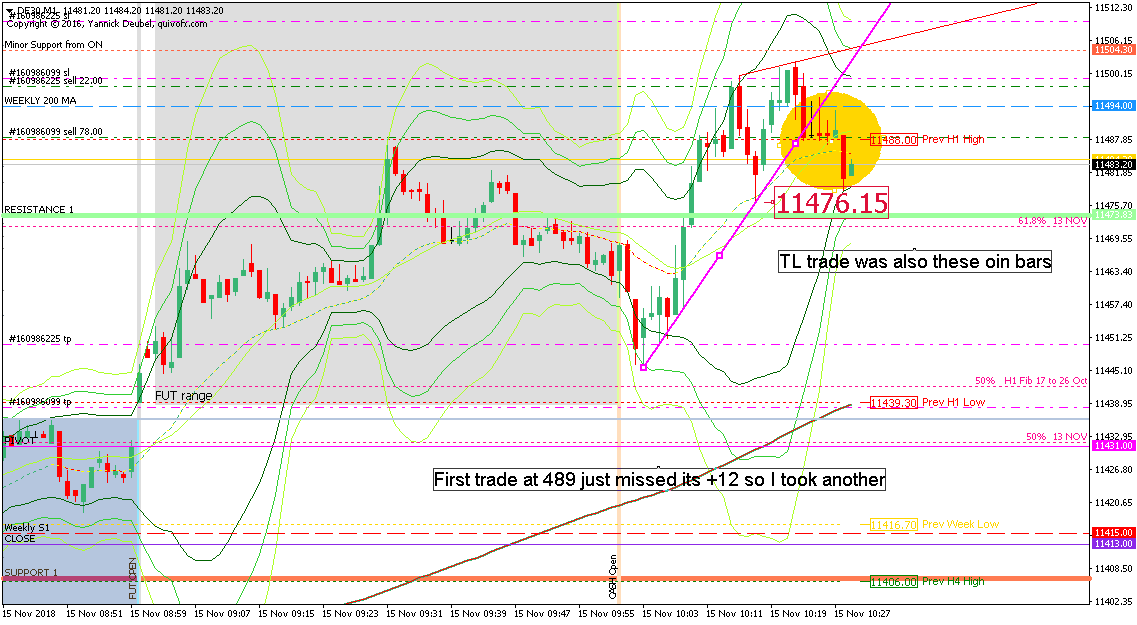
15 Nov – weekly 200MA tops gains and prompts reversal
15 November 2018Pre-open Scenarios
This trade had been setting up for more than a week. The TL supporting the corrective up move following the October decline kept breaking but not going anywhere. It would then form another TL supporting a corrective climb in prices. This cycle was repeated three times until it broke today.
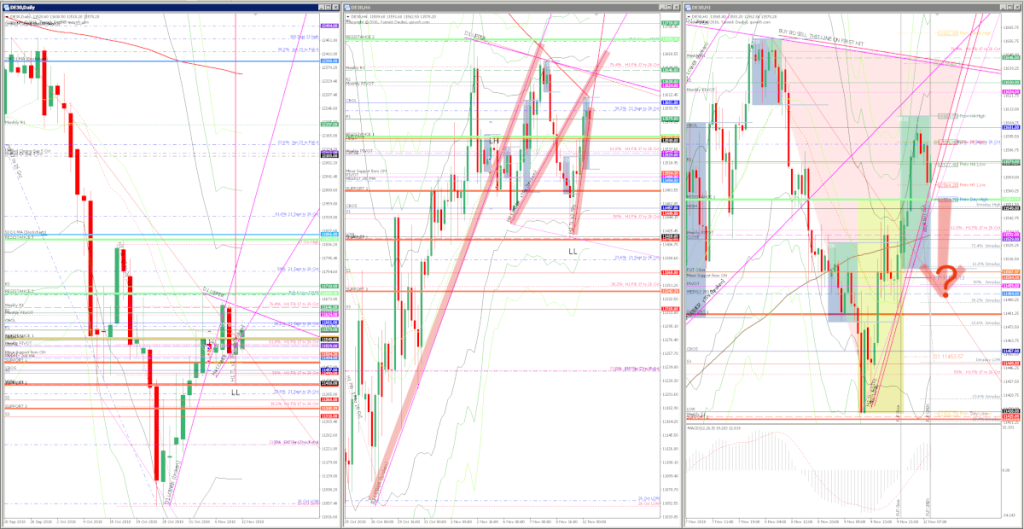
The middle chart show the three TLs I describe above and the H1 chart on the left shows the potential of a break.
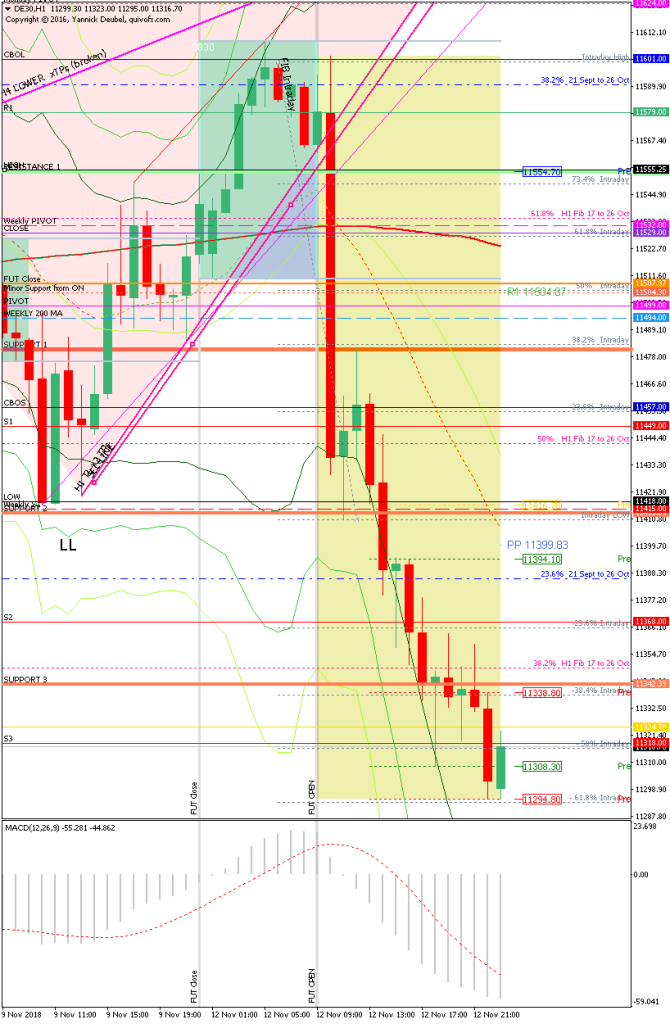
This is what the H1 chart looked like by today’s close
Strategy for today’s PA
[Chart with numbered points saying what worked]
What I did
hh:mm Buy/Sell x ?? @ ??? for SETUP + LEVEL| P&L = +/-???R
hh:mm Buy/Sell x ?? @ ??? for SETUP + LEVEL| P&L = +/-???R
hh:mm Buy/Sell x ?? @ ??? for SETUP + LEVEL| P&L = +/-???R
TOTAL = x.xR (put this in a grey block)
Today’s most gorgeous setup
Chart plus short explanation


