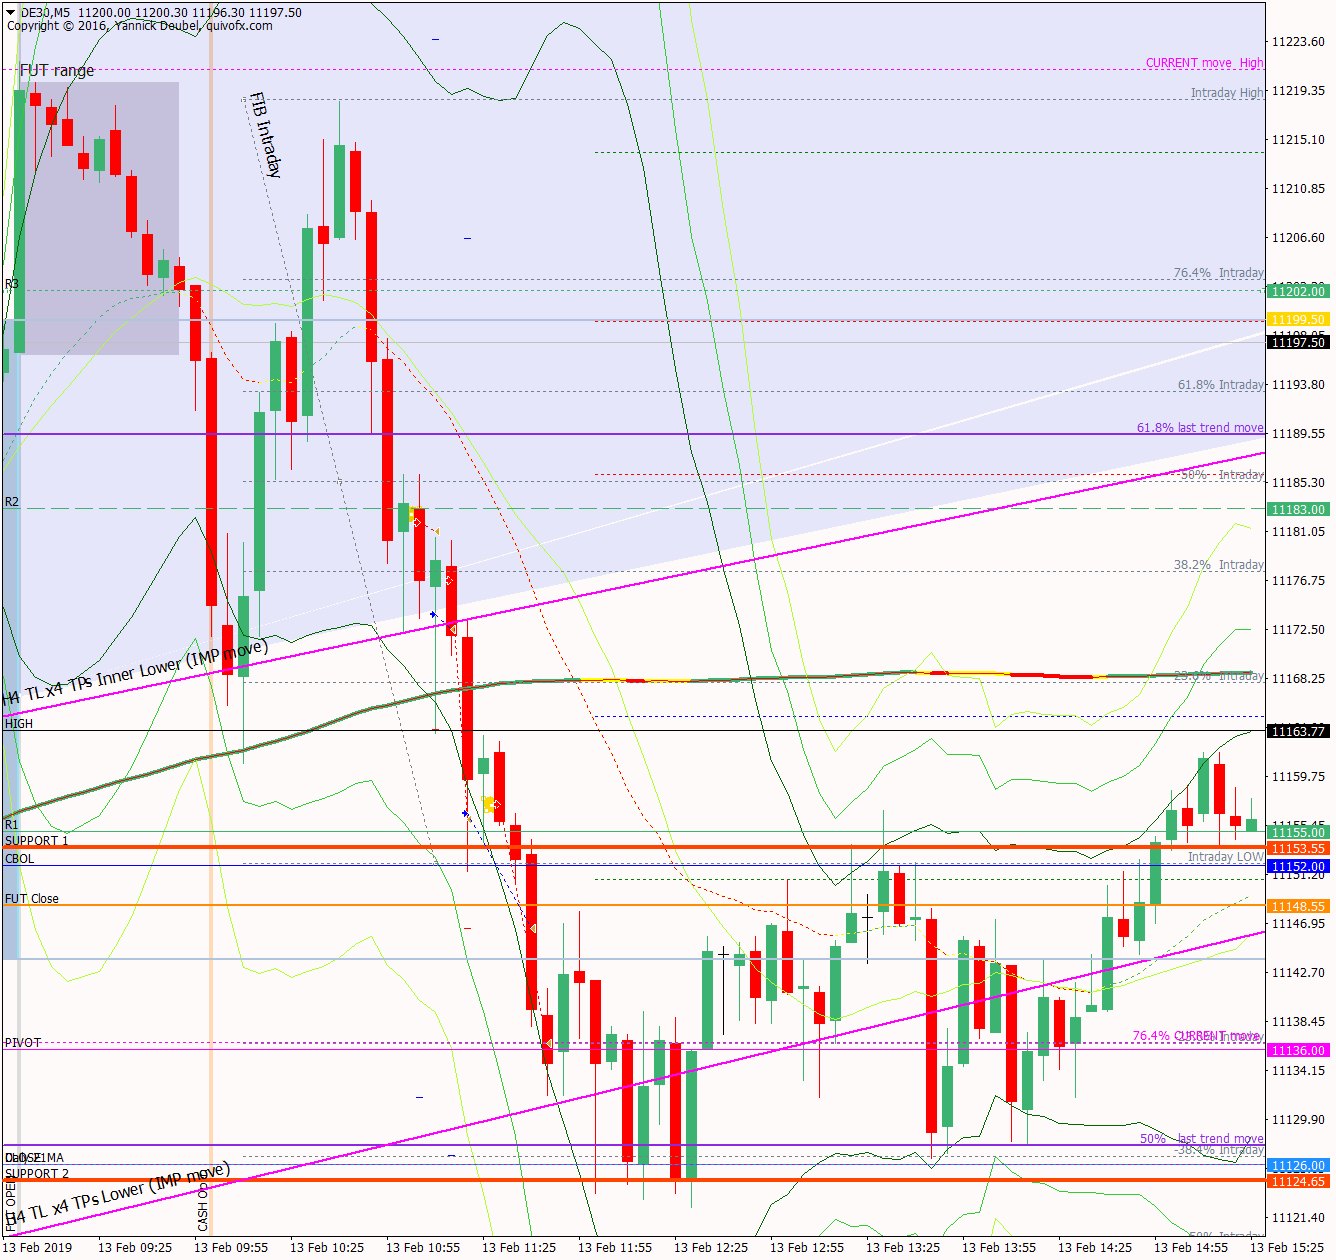
13 Feb – LH after ex-gap close and then breaks TL for a move down to daily chrrt 21MA
13 February 2019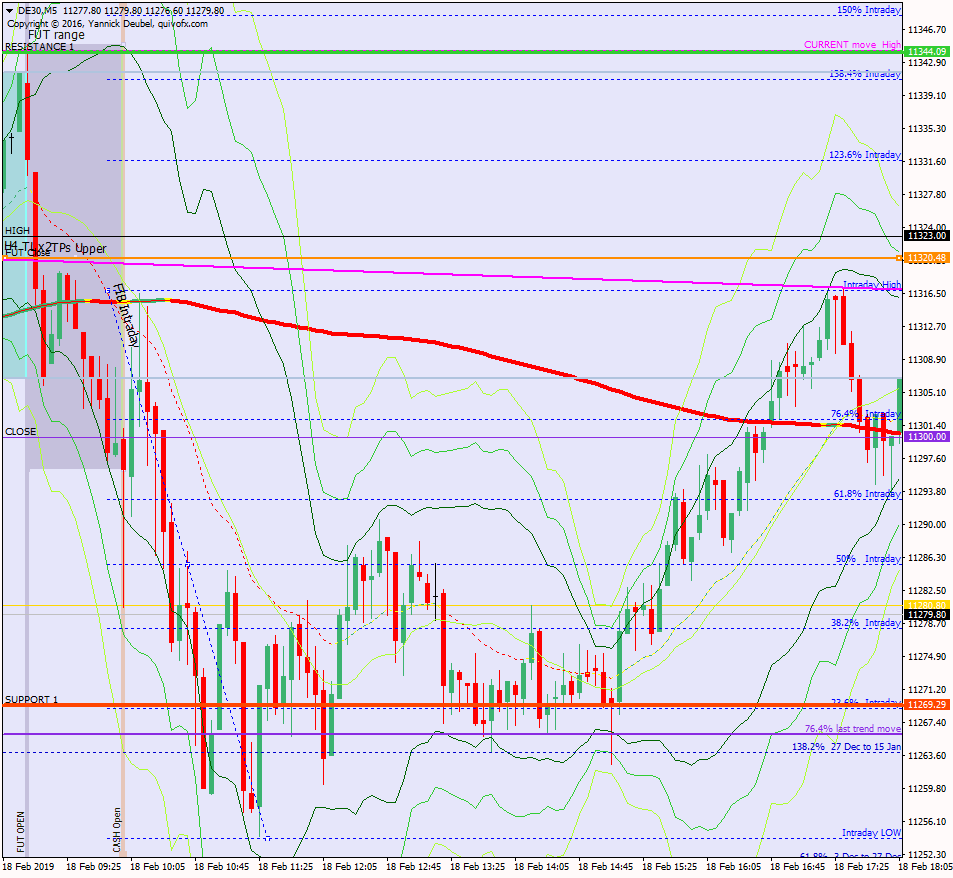
18 Feb – Market doesn’t want to retrace
18 February 2019Pre-open Scenarios
Yesterday the market went up, then down and then up gain to close slightly positive. This means we have some very clear levels for today. Also, a new TL has developed (uppermost downward sloping line) and if this caps prices today – or if we see a false break – it could the sign that the short term bullishness is rolling over. If the market cannot reach the previous KSP at 11,368 or close the gaps that lie unfilled at 11,324 (6 Feb) and 11,465 (4 Dec).
Overall, the market has moved below its upward channal and is now compressing (5-Day ATR is back below 150), implying that it is gathering strength for the next move. The compression is forming a triangle on the daily chart so breaks of these TLs determine the direction over the next few sessions.
Futures opened at 11,202 which is within yesterday’s range, 35pts above yesterdays’s cash close and 19pts above the futures close.
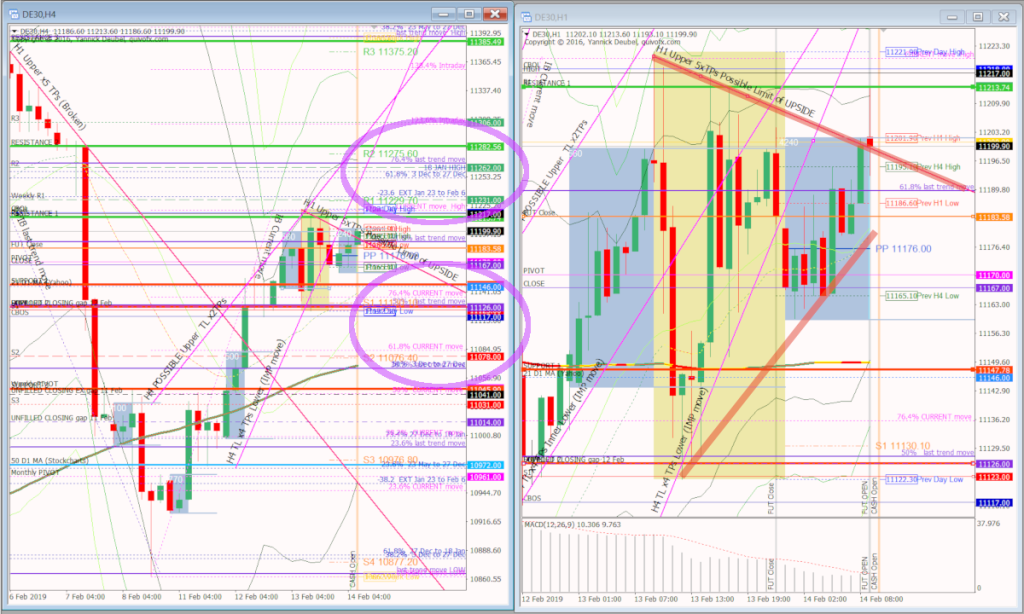
H4 and H1 charts from morning futures session
What the market looked like at the end of the day
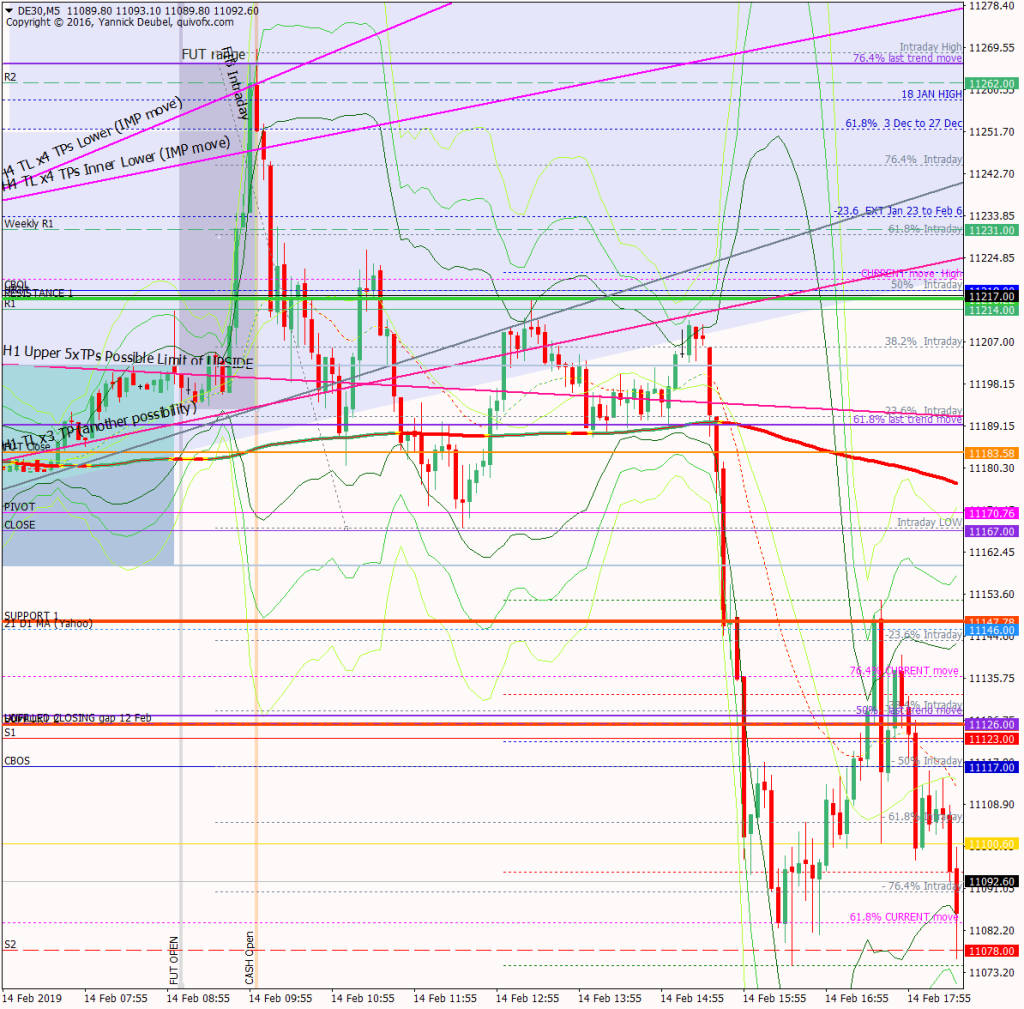
This was an incredible move and it shows the real power of the pivots. Key points are:
- the move during the second half of the futures session appeared to come from nowhere but respected the R2 level, where there was also confluence with a fib
- this reversal set up beautifully at the open for a 10+R trade – selling R2 would have made sense anyway but the move outside the 3Min Bolli Bands was the icing on the cake
- the reversal paused and compressed around RES 1 which was CBOL/R1/y’day High, giving more shorting opportunities to target futures gap close
- from there it bounces back up to RES 1 and then made a predicatable move to gap close
- from there the market tightened, making LL-LH along and not able to gain much traction back inside the Neutral Zone
- after the market’s final, rejected attempt to make it back into the Neutral Zone, it was curtains for the bulls and the maket dropped like a stone to S2
Key points about today’s PA and setups that worked
How effective was my Neutral Zone? The upper edge was not in play but the lower TL bound was fairly accurate; there were two possible TLs and a lot of levels around the lower bound which muddied the picture, but the final retest of the TL which was also an LH was a magnificent trade.
How precise were my levels? RES 2 should maybe have been at R2, but I knew I would trade this level anyway. As with the lower bound TL, there were a lot of levels in the area of RES 1 but this level presented two great trading opportunities and after a price went through it, it set a negative tone for the whole of the session.
What I did
TOTAL = -5.7R | # Trades 29 | Winners 6 | BE 7
Average R per winner 1.9 | Losses > 1R 0 | Scratched (Loss >1R, >0.1R) = 1
R-multiples: trades 2:1 or more 4| trades 5:1or more 2
Outcome using standard TP strategy and same trades:
(STE at 1:1 50% off at +20 and 50% off at +50)
4R + 7R + 7 x BE + 7 + Full loss x -16R = 5R
Trades opened after midday were responsible for -4.7R so I will open a new account and use it for trades after 11:00. And especially when I want to make some experiments – this will give me an easy way of being conscious about the decision Am I trading or am I experimenting?
Today’s most gorgeous setup
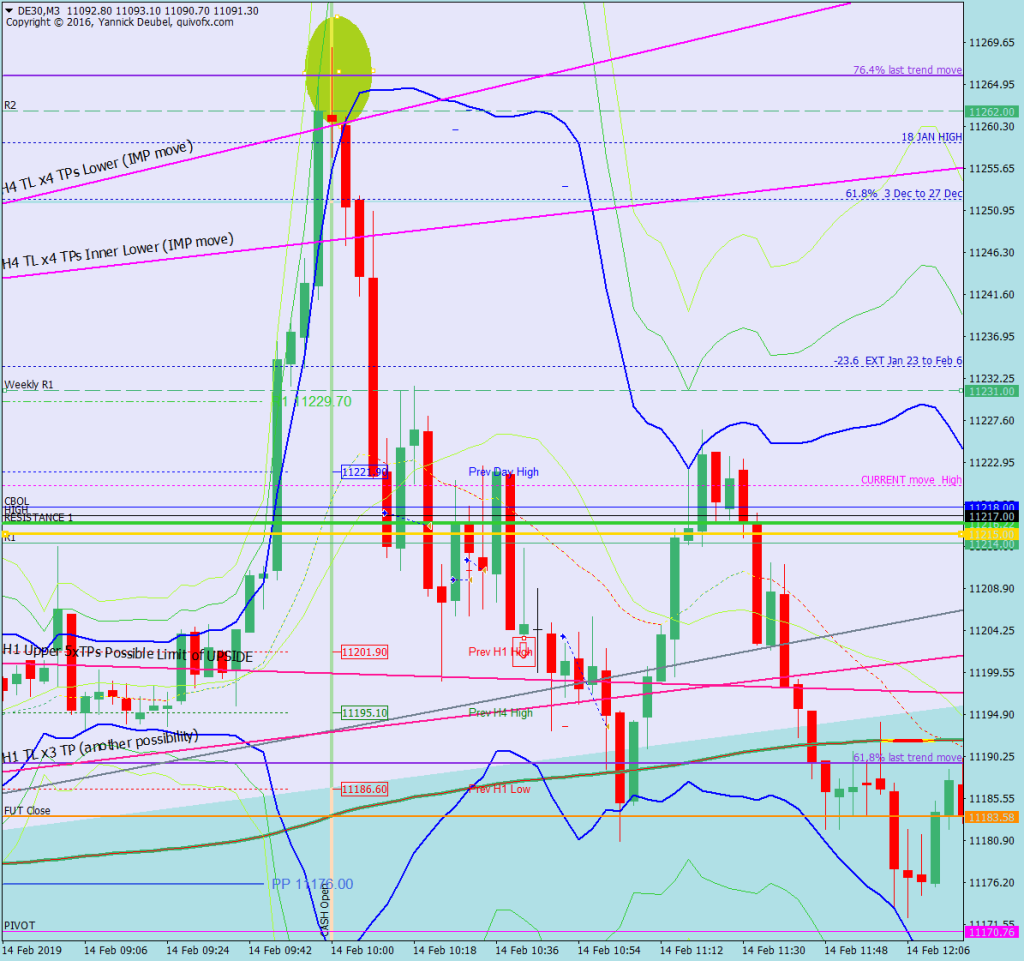
This was the 3Min Bolli set up at R2 just after the open. There had been a massive buy-in durting th
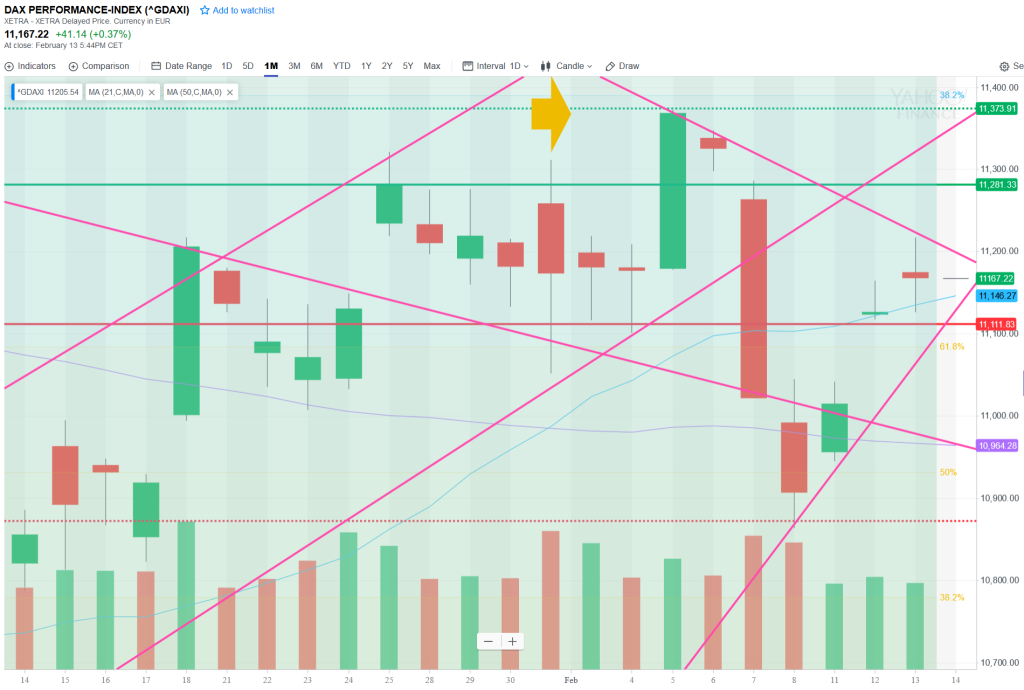
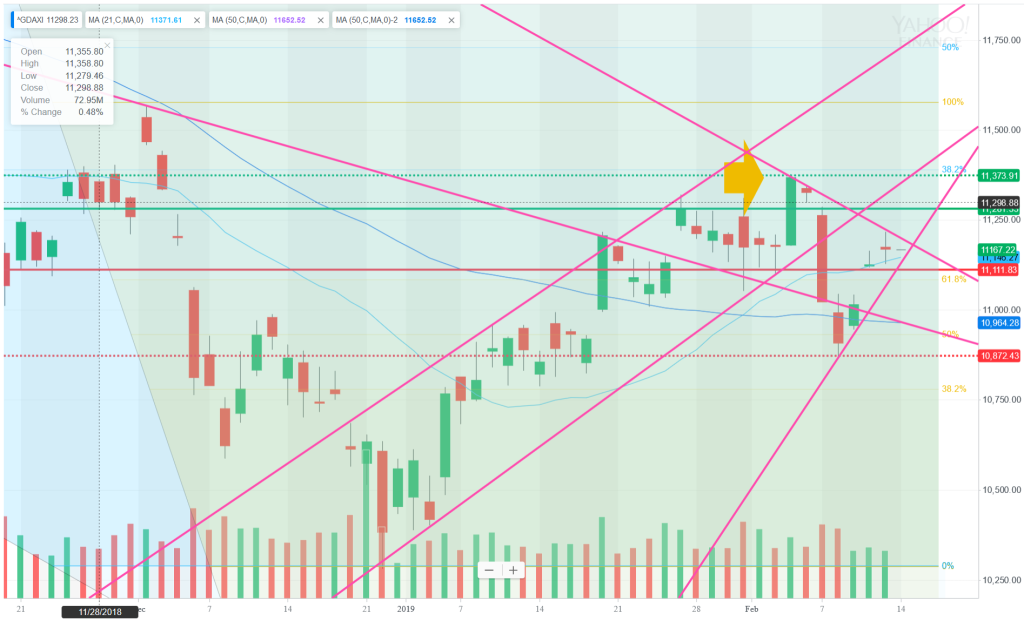
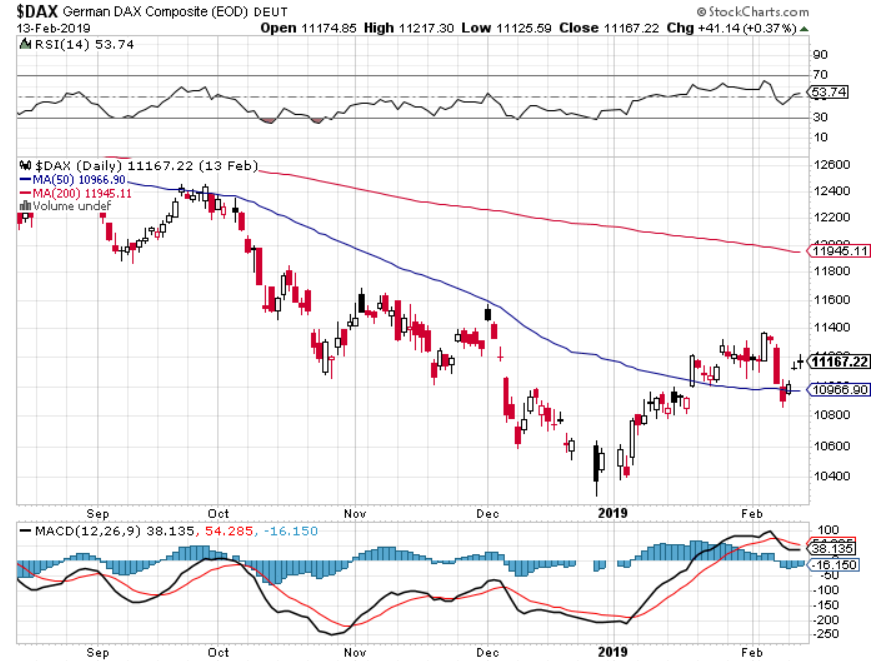
For reference: 6 month cash chart at COB yesterday


