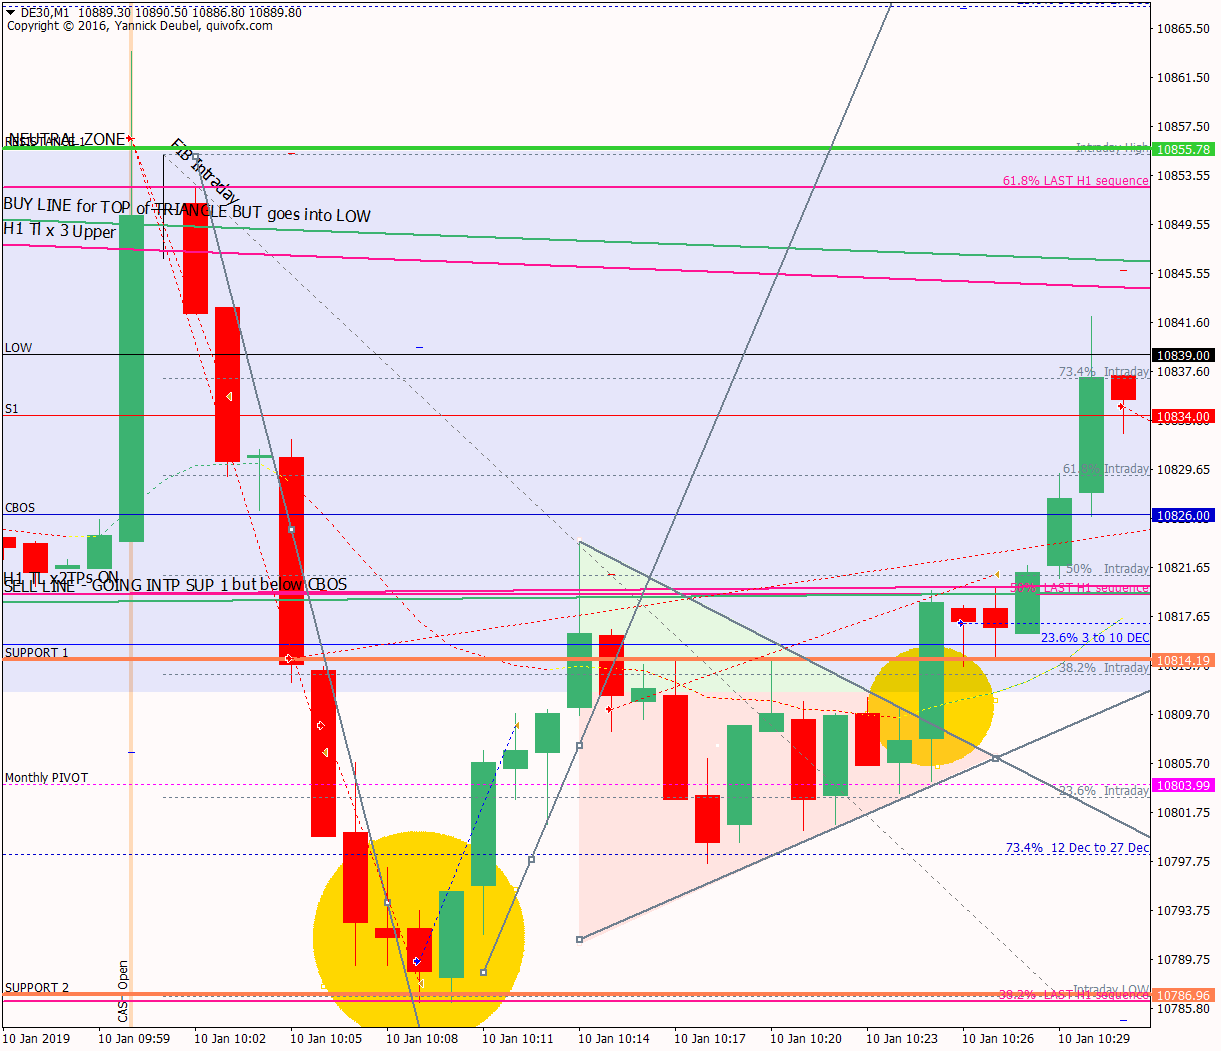
10 Jan – Quick and then a powerful wave of buying
10 January 2019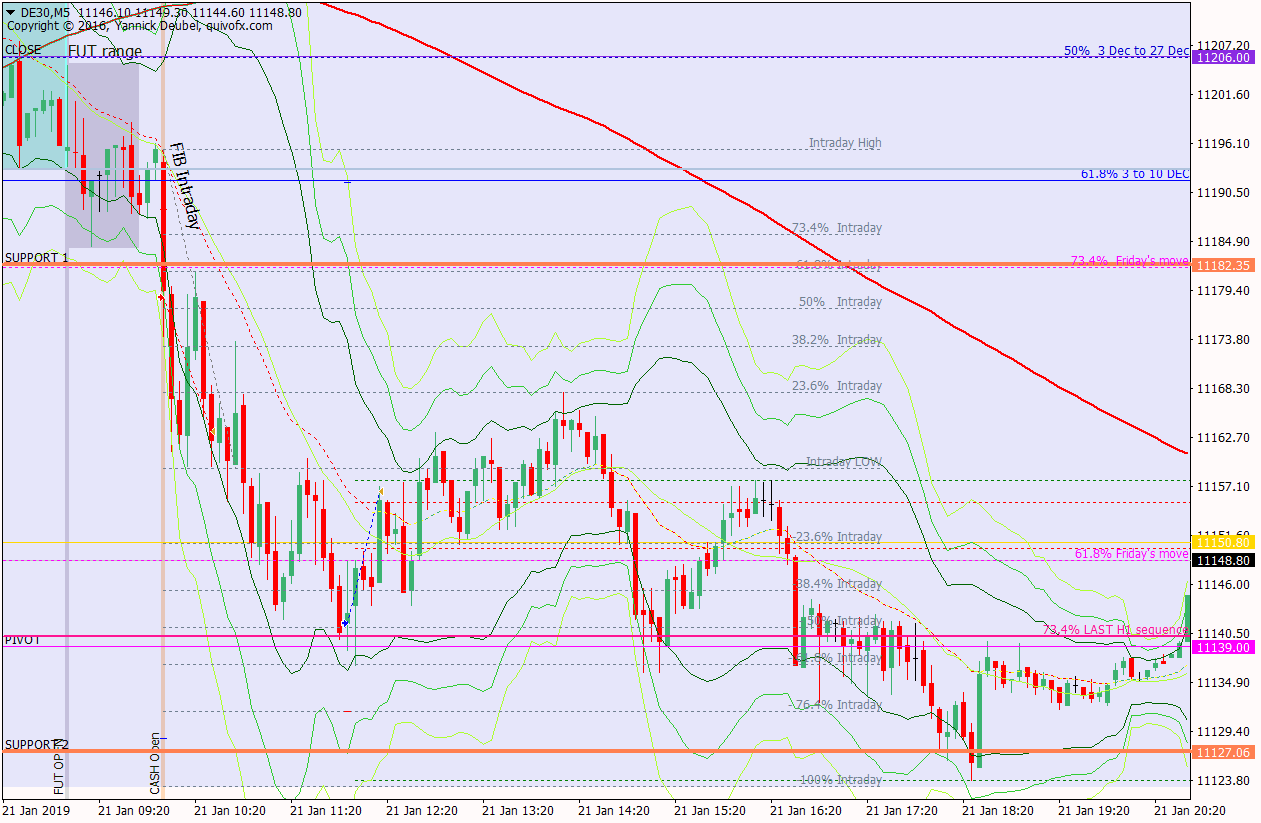
21 Jan – Long slow grind down to just say of 50% retrace of Friday’s move
21 January 2019Pre-open Scenarios
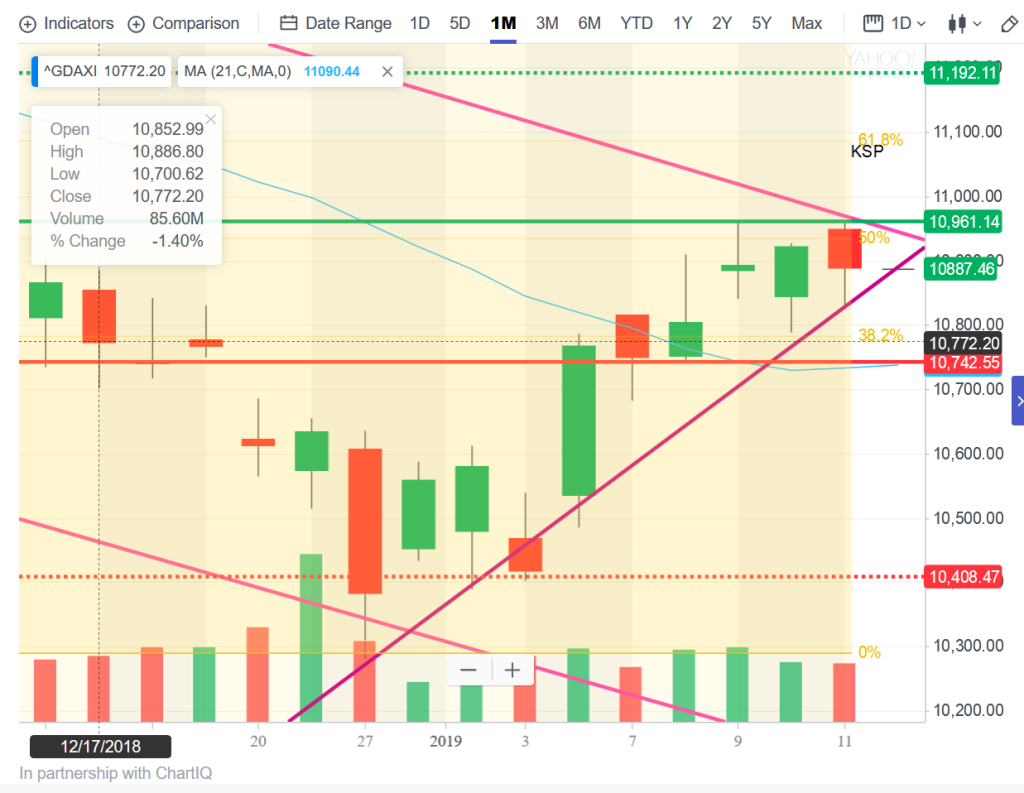
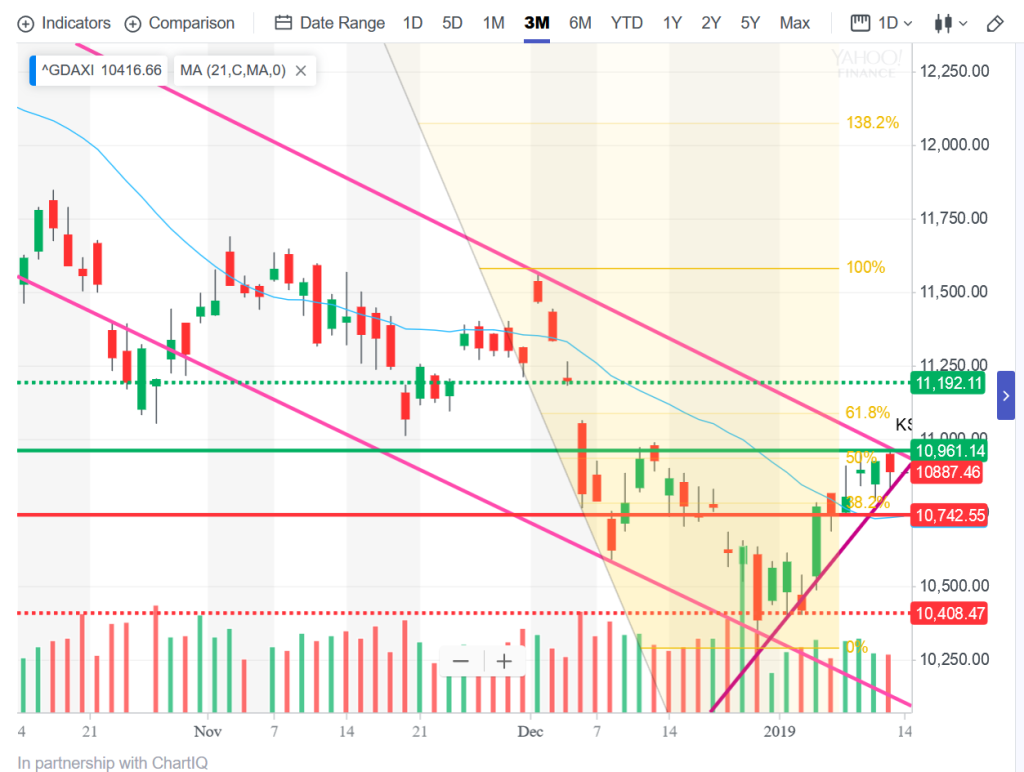
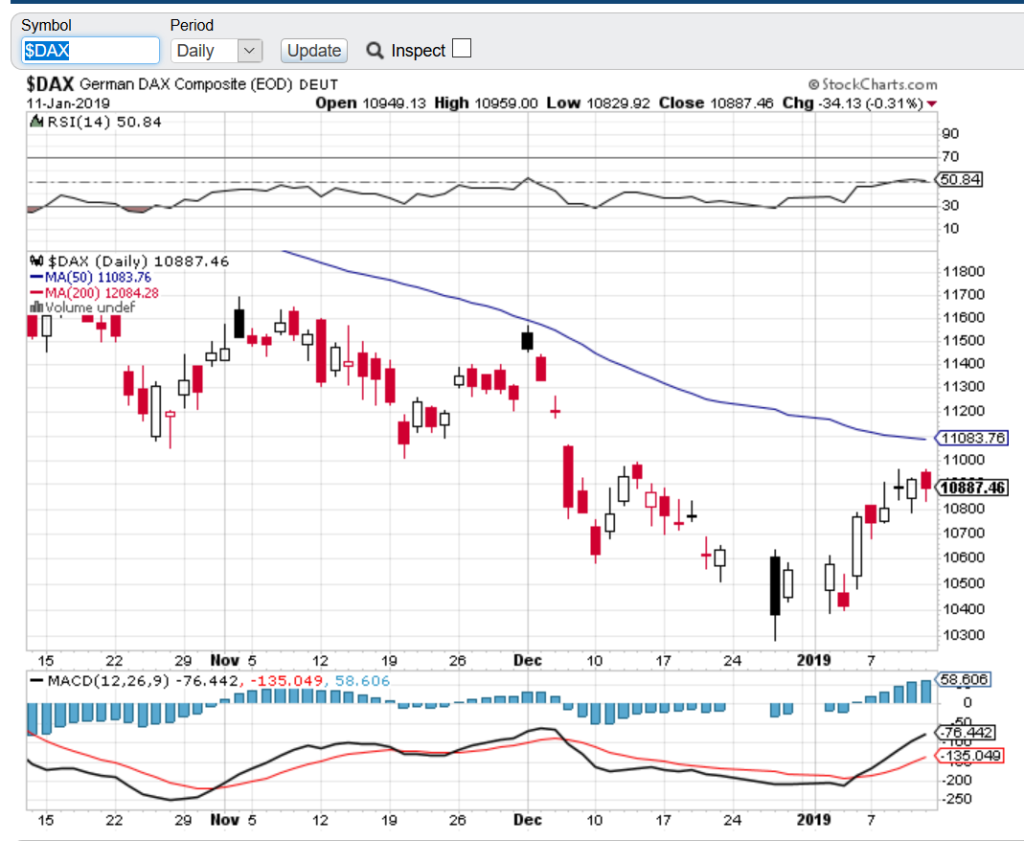
The move upward – after the initial push has always looked corective in nature. On this chart, showing 1month’s prices, the market looks like it could be in an up trend, but seen in te context on 3Mth (below), recent PA shows itself as more likely a correctice move in a bearish over all picture. The market closed on Friady at aroud the 50% fib retrace of the move down from 3 to 27 December 2018.
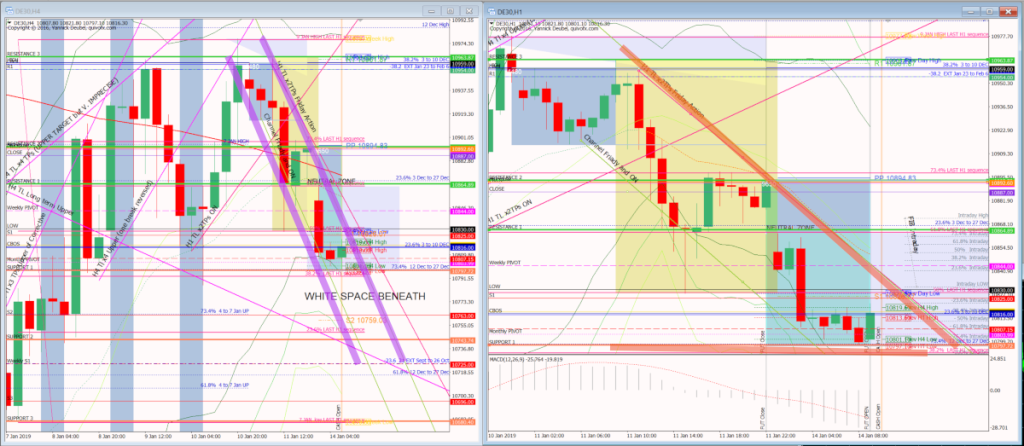
The futures opened at 10801, which was a 86pt gap down from Friday’s close. The cash opened 11pts higher at 10812. It went immediately for the ex gap at the open and exceeded it by
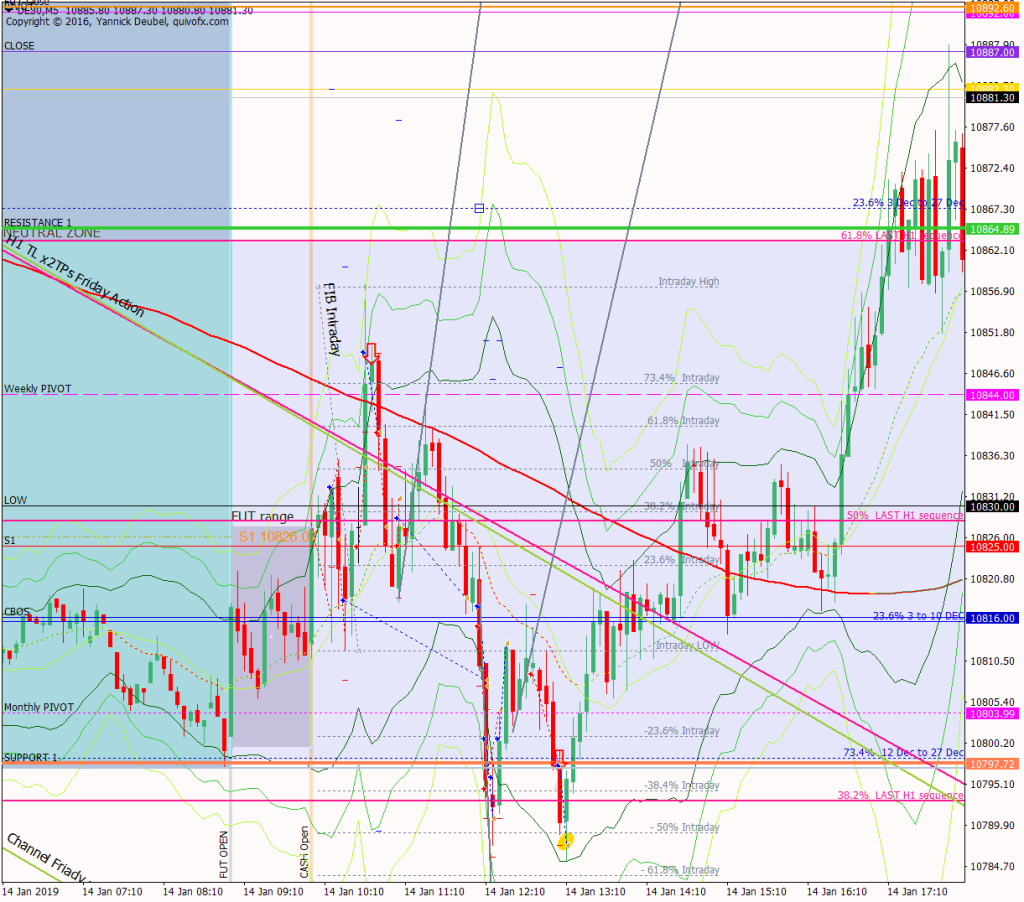
What the market looked like at the end of the day
Key points about today’s PA and setups that worked
How effective was my Neutral Zone? The upper edge of the zone should have been the downward sloping TL as this was far more important than to the market than my RES 1. Having said that, there was a lot of action around the upper edge later in the day, so it was definitely valid. Breaks of the lower edge saw a rush of sell orders which were quickly bought up.
How precise were my levels? SUP 1 was too high and this cost me trades today; it should have been at the Fib, as this was the level the market was responding to. RES 1 saw a lot of activity, bit this line should really have been at the weekly pivot as this level almost always reacts.
What I did
TOTAL = -2.1R | # Trades 19 — Winners 8 — BE 0
Average R per winner 0.8R — Losses > 1R 0
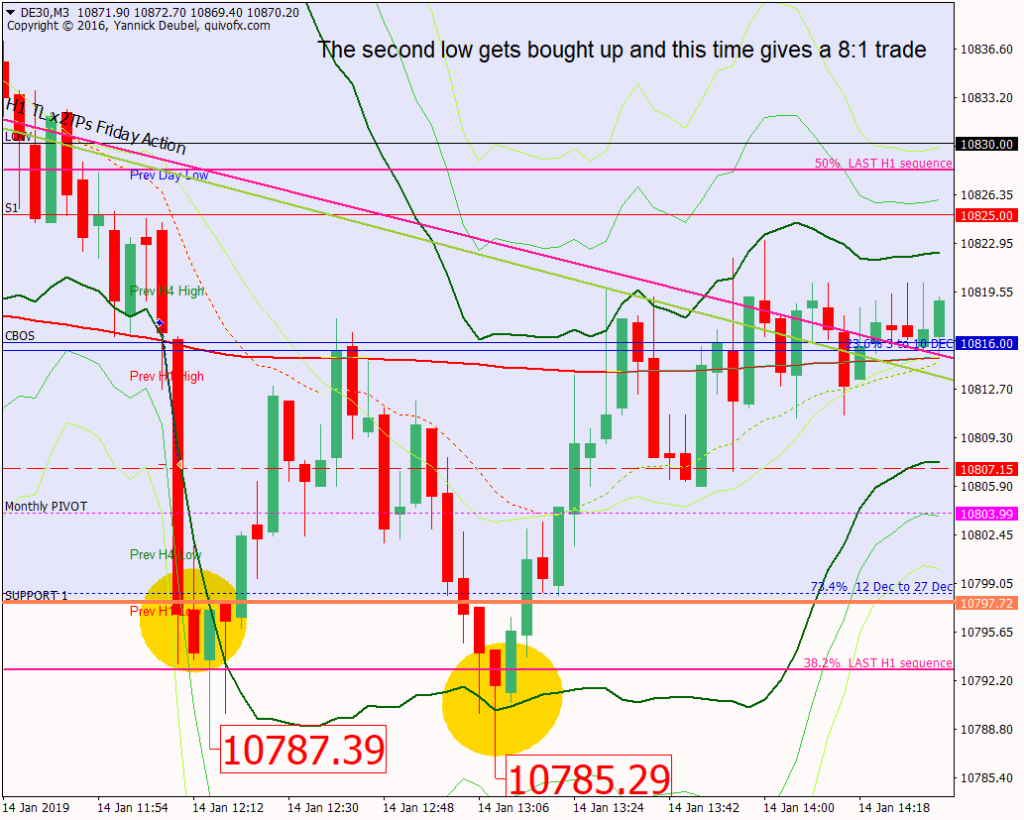
Today’s most gorgeous setup
This was a tricky day’s trading, in the first hour and a half, the market moved just 40pts. Once CBOS broke things started to get interesting. It took attempts, but the best trdae (8:1) was he second buy at SUP 1 – the market made a break of 2pts below the previous low and then made a dramatic reversal.
For reference: 3 month cash chart at COB yesterday


