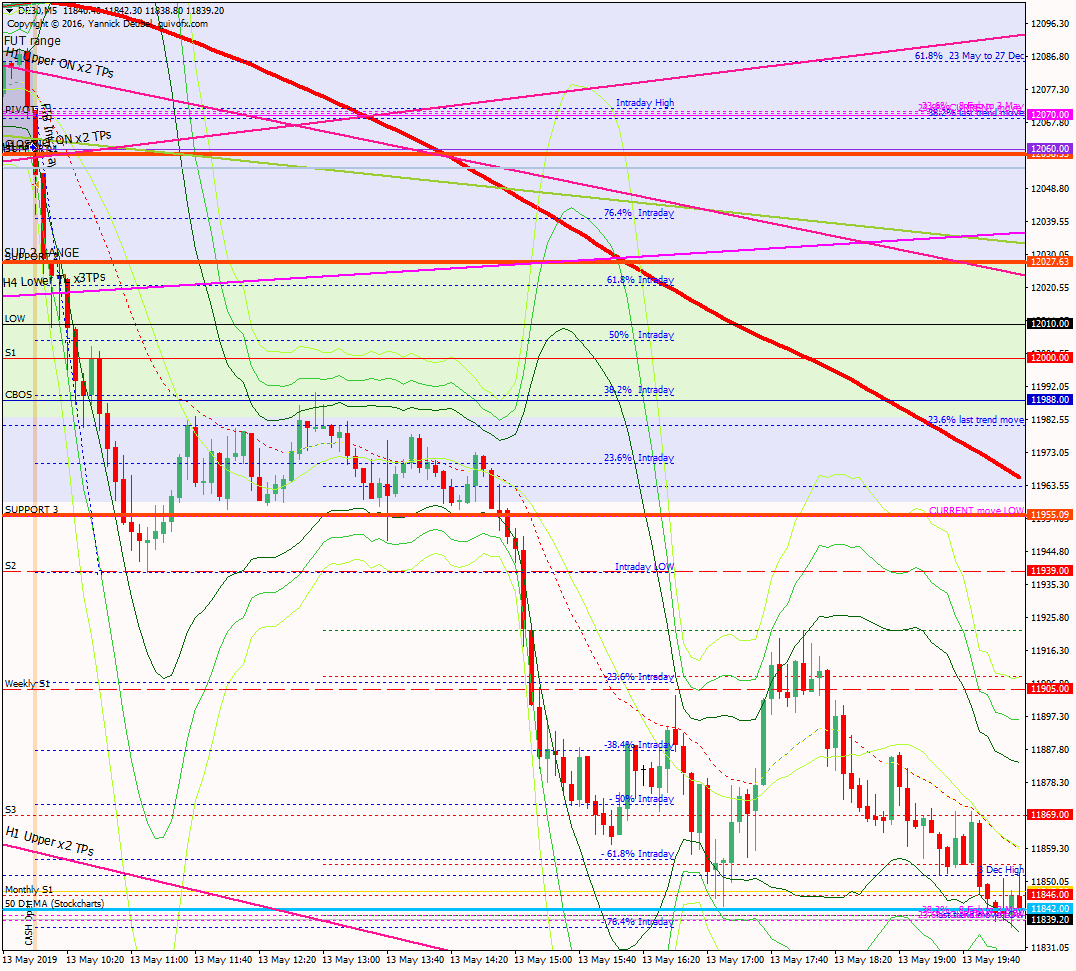
13 May: Breaks support and 250pts comes off the market
14 May 2019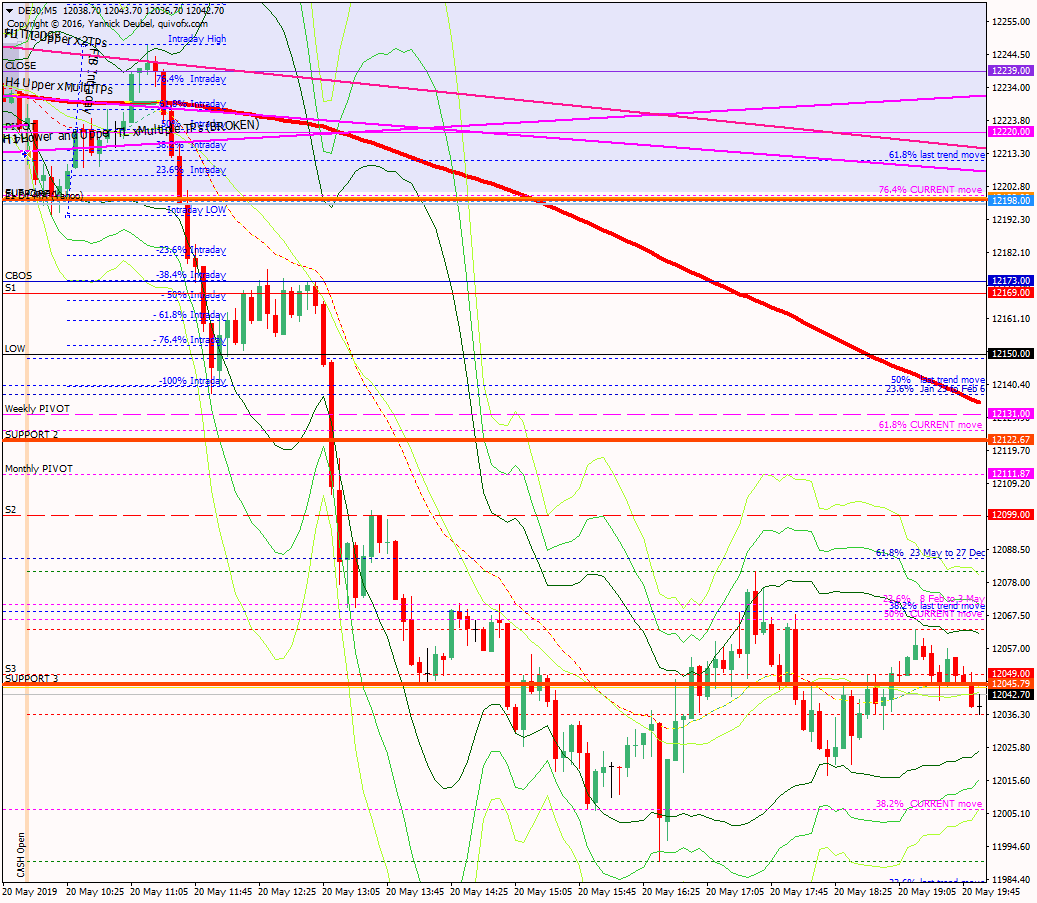
20 May: Fills the gap then it’s curtains for the bulls
20 May 2019Pre-open scenarios
The market had a big down day yesterday and in so doing, it reached two critical cash chart levels: the daily chart 50MA and the weekly 50MA. The low was just shy of the weekly MA at 11814 and from there, there has been 100pt rally.
The question today is therefore quite obvious – will it power upwards in a massive relief rally, or will the buying peter out early on, allowing for a move down to fill the gaps below. What doesn’t happen at today’s open will be as important as what does; if there is no selling towards the gap, then we will see higher and a big trending move will most likely unfold. But if sellers readily appear and take the market back down from its ON highs, we will most likely see the gap at 11750 fill sooner rather than later.


Futures open
Futures opened at 11892.
- A gap of +15pts against the cash close and +44 against the futures close.
- The futures open was within yesterday’s range, so there are no ex-gaps.
H4 and H1 charts just prior to cash open

Timestamp: 8:53
Best fit, if there is one, is highlighted in red at the end of the day.
Scenario 1: the market will rip up from the open, powered by the bounce off the key cash chart levels and make a strong trending up to 12000 and then 12053 later in the day
Scenario 2: the market will close the gap at 11877 – perhaps retesting the ON highs before it does so – and then it will trend up towards CBOL at 11991 and R1 at 12005 – this was the closest, although it didn’t make it down to the gap and found support at weekly S1
Scenario 3: the market will range between gap close at 11887 and 11966 (23.5% of current move) and 11991, but eventually break down to head for the unfilled gaps from 2nd April at 11754
After the cash close
End of day H4 and H1 charts

Intraday M5 chart

Core trading hours PA M1 (9am to 11am)

Key points about today's PA and setups that worked
On the higher TFs, PA looks very clear: the TL that formed from the buying from cash chart daily 50MA and weekly 50MA looks to have supported a strong move up to expected targets. But on the M1 and M5 chart, the PA is spiky and hard to trade with my usual setups
- Weekly S1 was clearly the level at the open and the buying from there propelled the market up to RES 1 and the H1 Tl
- From there it made a shallow pullback to the pivot and the 50% intraday and the next round of buying took it up to the upper side of the channel that contained the last trend move down
- It rejected this level and returned to weekly S1
- From weekly S1 it formed an upward channel around the H1 TL that is shown on the H4 and H1 charts above
- This reversed at the previous HOD (classic ranging action) and then made an HL around the pivot and TL
- Once the US opened, the market made a strong trending move up to RES 2.
How effective was my Neutral Zone? Neither edge of the Neutral Zone was in play today;on reflection, a better positon for the upper edge would have been the upper edge of the channel as breakout of that was obviously what the market was looking for
How precise were my levels? RES 1 was not effective as the TLs weremuchmore in control today; Res 2 was spot on
How effective was my Neutral Zone?
Each day, I would define a neutral zone within which, PA could be deemed directionless.
Neither edge of the Neutral Zone was in play today. On reflection, a better position for the upper edge would have been the upper edge of the channel, as this is where the market was looking to breakout of.
How precise were my levels?
RES 1 was not effective as the TLs were much more in control today; Res 2 was spot on
What I did

TOTAL = -0.5R | # Trades 9 | Winners 2 | BE 3
Average R per winner =1.7 | Losses > 1R = 0 | Scratched = 0
R-multiples: trades 2:1 or more = 2 | trades 5:1or more = 0
Outcome using standard TP strategy and same trades
2:1 trades (2R) + 5:1 trades (0 x 2.5R) + BE (0R) + Losses (-4R) =-2xR
My results vs. SYS = +1.5R
ON TILT trades = 3 (-2R)
Average coherence = 3.1
Today's most gorgeous setup
Weekly S1 is a strong, strong level and a spike down into it, while outside the Bolli on the M3 chart was a must-take trade. This reached 49 pts before reversing at on a retest of the channel

For reference: 6 month cash chart at COB yesterday


