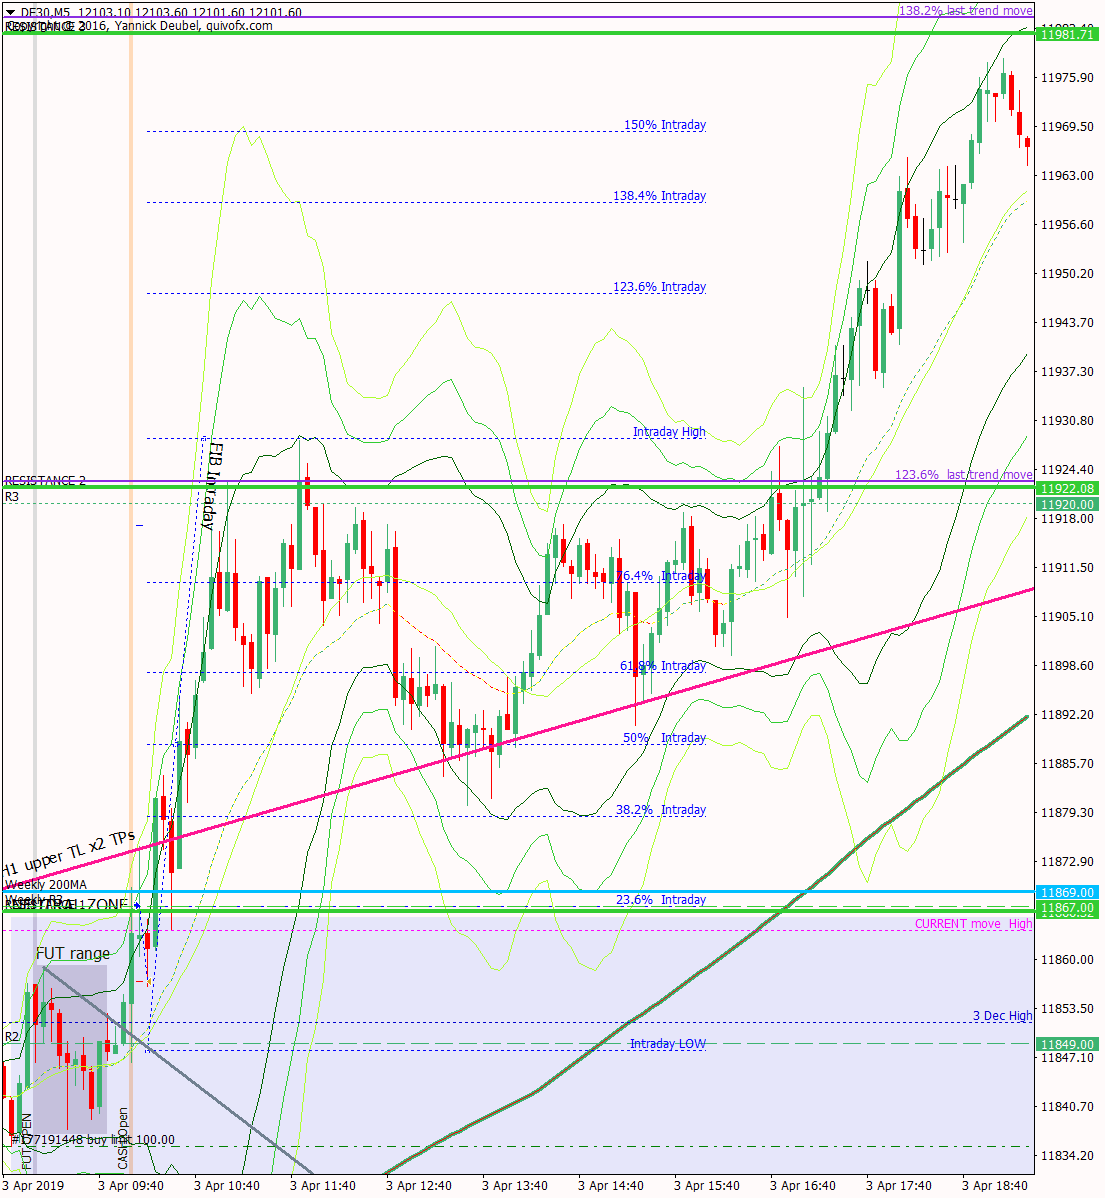
3 Apr – Up trend continues and is unphased by weekly 200 MA
3 April 2019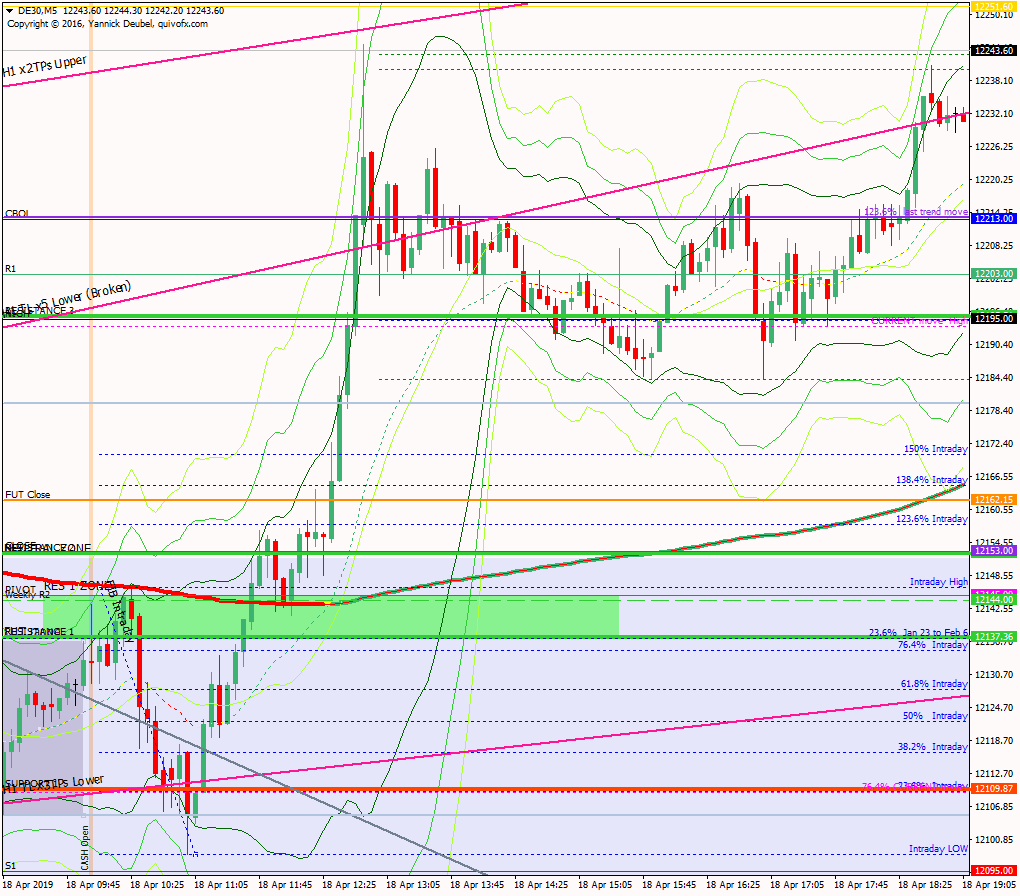
18 Apr – Pops down to BNR then trends up all day to exceed CBOL
23 April 2019Pre-open scenarios
The uptrend continues, conforming to its trendlines and forming a rising wedge. Yesterday the market filled the gaps from October 5 2018 and it is at a significant level on the long term daily chat – including the 61.8 fib of the retrace of the down move from May last year. So the question is whether the trend will continue of whether we’ll see a small pullback opr a deeper one.


Futures opened at 12102, leaving a gap of +1pt against the cash close and +11 against the futures close. The futures open was within yesterday’s range so there are no ex-gaps.
Physical/body
Sleep – what time did I go to bed? 23:00 so 7.75 hrs sleep
How much coffee have I had? half a small pot
How do I feel? pissed off with lack of progress on Neurotrder but also aware of patterns
H4 and H1 charts from the morning futures session


Time stamp: 8:43
Scenario 1: Hits prev. day high at the open then reverses down to fill futures gap then goes on to break high and up to CBOL and pivot area – SPOT ON
Scenario 2: Opens around yesterday’s close – maybe retests close – and then falls away during the day to the 73.4% and then breaks that to move down to the CBOS area
Scenario 3: breaks yesterday’s high early on, vibrates and retests and then sees a trend up day
What the market looked like at the end of the session

PA during my trading hours

Key points about today's PA and setups that worked
The range during my session was a measly 35pts as the market traded between prev. day high and futures close.
- in the first minutes the gap filled and reverse and this was also a 2:1 (just) 3Min Bolli setup
- a few bars later, the market hit RES 1 and this set up as another 2:1 3Min Bolli
- after that the PA tightened into a triangle around the 169 as is typical for a ranging, directionless PA
- the triangle broke downwards to fill the futures gap where a 2:1 3Min Bolli long set up
- after this price just hovered around the close, munching stops before it broke higher just after 11:00
How effective was my Neutral Zone? Prices stayed within my Neutral Zone during the trading session but broke out upwards later in the day; the pre-breakout high was 12141, a few points below the Neutral Zone boundary at 12 144, once it broke this level, it retested once and then trended, indicating that the level was pretty accurate.
How precise were my levels? RES1 was logical and exceeded by 6pts so set up for a successful 3Min Bolli; RES2 was between weekly R2 and CBOL – this would have been a cash for RES range with a strong and strong, strong level within 7pts of each other.
What I did

TOTAL = -4.7R | # Trades 18 | Winners 3 | BE 3
Average R per winner = 1 | Losses > 1R = 0 | Scratched (loss<1R) = 2
R-multiples: trades 2:1 or more = 3 | trades 5:1or more = 0
Outcome using standard TP strategy and same trades
2:1 trades (3R) + 5:1 trades (0 x 2.5R) + BE (0R) + Losses (-7R) = -4xR
My results vs. SYS = -0.72R
ON TILT trade = 2 (-1.1R)
Rule of 3 trades = 2 (-2R)
Scratched trades = 2 (variance vs. rules = -2R)
Today's most gorgeous setup
There wasn’t a 5R during my trdaing session (although one did set up just afterwards as a 3Min Bolli entry), so today I will include my favorite setup as the gorgeous trade of the day. It was horrible PA but this trade kept me out of trouble with one BE and two 1R trades.

For reference: 6 month cash chart at COB yesterday


