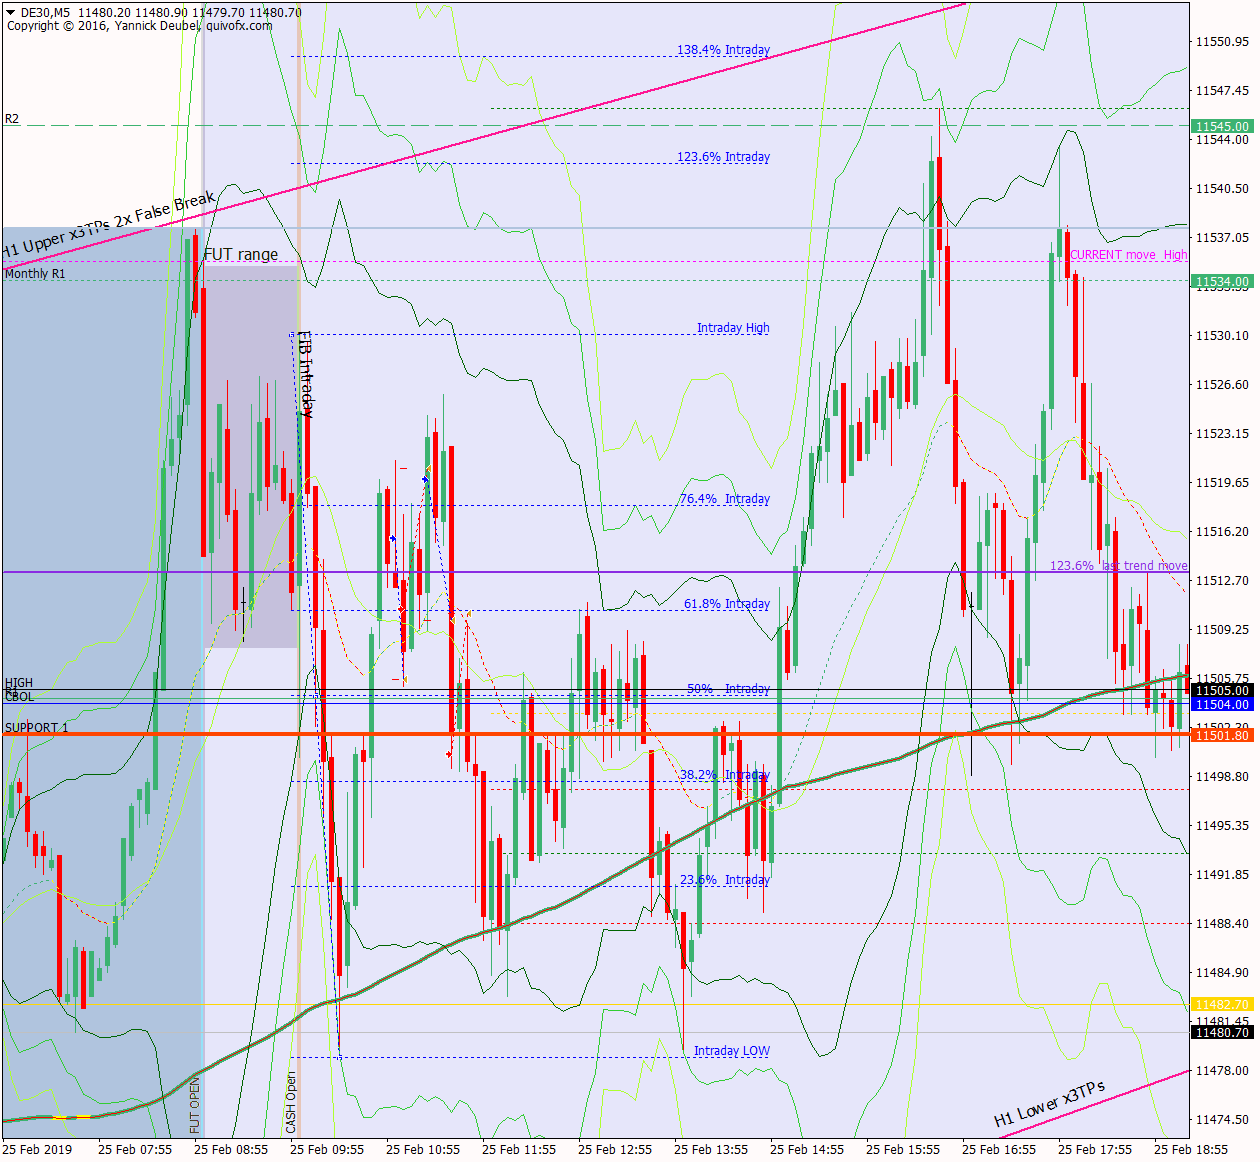
25 Feb – Tight range and ON levels in control
26 February 2019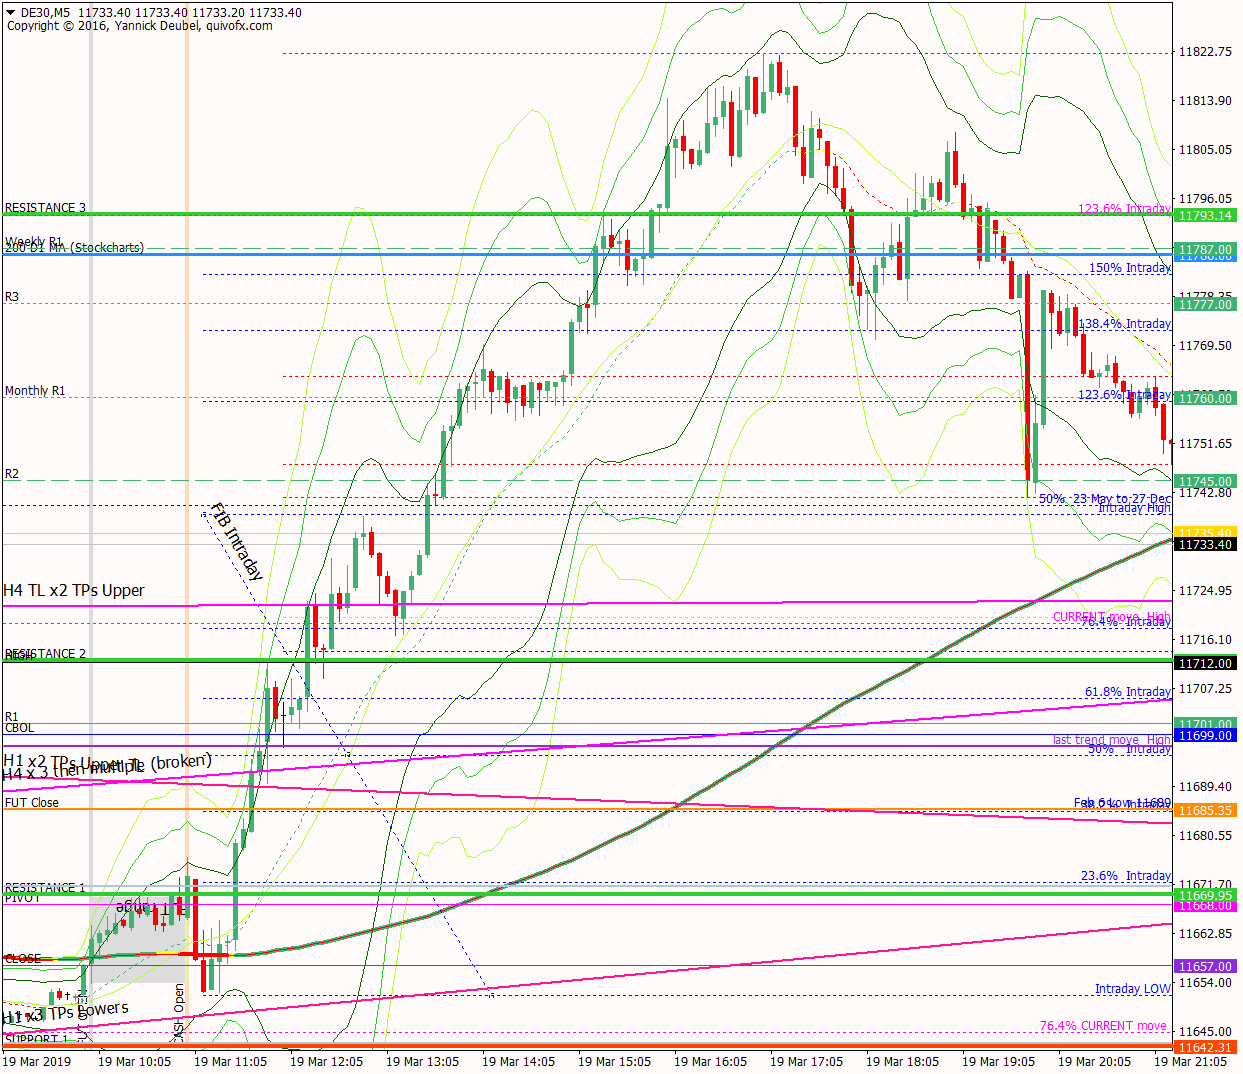
19 Mar – Closes the gap and then steams through levels with hardly a pullback to be seen
19 March 2019Pre-open scenarios
The market is in a clear, but slowing uptrend. It has formed a new upward TL to support it but has dropped out of the initial uptrend. Above, there are lots of levels to aim for, with Friday’s high and a significant previous low at 11724 and daily cash chart 200MA at 11789. I will trade long today above Friday’s high but will be mostly focused on TL breaks to the downside. I will also be looking for value levels to buy – perhaps the pivot at 11662 and then the weekly pivot at 11625.


Futures opened at 11703, leaving a gap of +17pts against the cash close and +16 against the futures close. The futures open was within Friday’s range so there are no ex-gaps.
Physical/body
Sleep – what time did I go to bed? 23:10, but woke up a lot during the night with a mixture of anxierty, huge energy and insight
How much coffee have I had? Half aluminium pot
How do I feel? Am I going to win today? Feel quite neuttral but out of practice so I will take it easy.
H4 and H1 charts from the morning futures session

For the market to go higher, it must break several lines of resistance: first is the TL from Friday’s high the ON PA and after that, there is Friday’s high at 11726 – which is also a long term PA KL. There are layers of levels below where orders will be waiting, including the 74.6% retrace of the current move and then the weekly pivots. If the market moves down through the upward sloping on the H4 chart, I will be looking to get on board for a large move.
What the market looked like at the end of the session

PA during my trading hours

Key points about today’s PA and setups that worked
ATR is 114 and the range during the first hour was 40pts
- in this low volatility environment the Jigsaw trade worked as expected for 1:1
- after this, fading the gap fills was the next obvious trade as trading at the gaps is the market’s path of laest resistance
- levels and TLs were respected and new highs and lows were sold and bought, so the 3Min Bolli system worked a treat here.
- once the amrket had accepted below Friday’s close prices it moved gently lower in a few tradeable moves but ended the day at -0.25%
- the market eacted to 11675 area today but I can’t see why
How effective was my Neutral Zone? All trade was within the Neutral Zone today and the market did not trend so I can assume that this was fairly accurate in describing where prices were in the doldrums
How precise were my levels? SUP 1 was the only level in play toady and it gave two nice 1R setups
What I did

TOTAL = 2.5R | # Trades 7 | Winners 4 | BE 1
Average R per winner = 0.9 | Losses > 1R = 0 | Scratched (loss<1R) = 1
R-multiples: trades 2:1 or more = 4 | trades 5:1or more = 0
Outcome using standard TP strategy and same trades:
(STE at 1:1 50% off at +20 and 50% off at +50)
2:1 trades (4R) + 5:1 trades (0 x 2.5R) + BE (0R) + Losses (-1xR) = 3R
Variance vs. SYS = -1R
Today's most gorgeous setup
This was a 3Min Bolli at a H1 TL and the second time the session that the level was hit. The market was in volatility mode with an ATR at 114 and a tiny opening range of around 30pts. The market made a new high above the TL but this was quickly sold, leaving a lovely doji. This was a 3.5R trade

For reference: 6 month cash chart at COB yesterday


