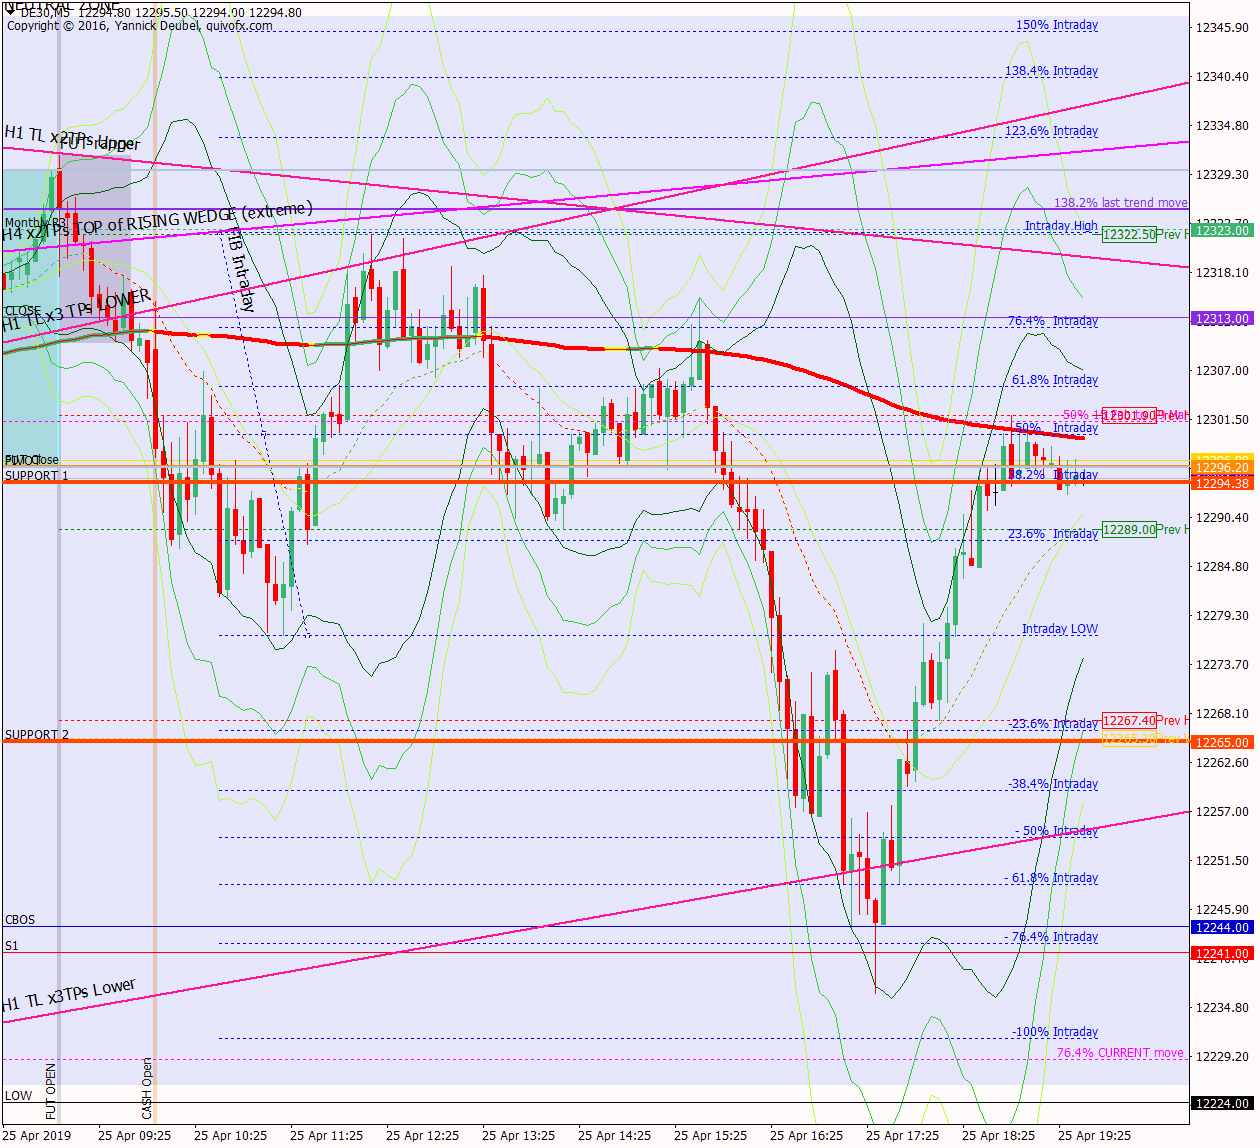
25 Apr – Nothing happened today …
25 April 2019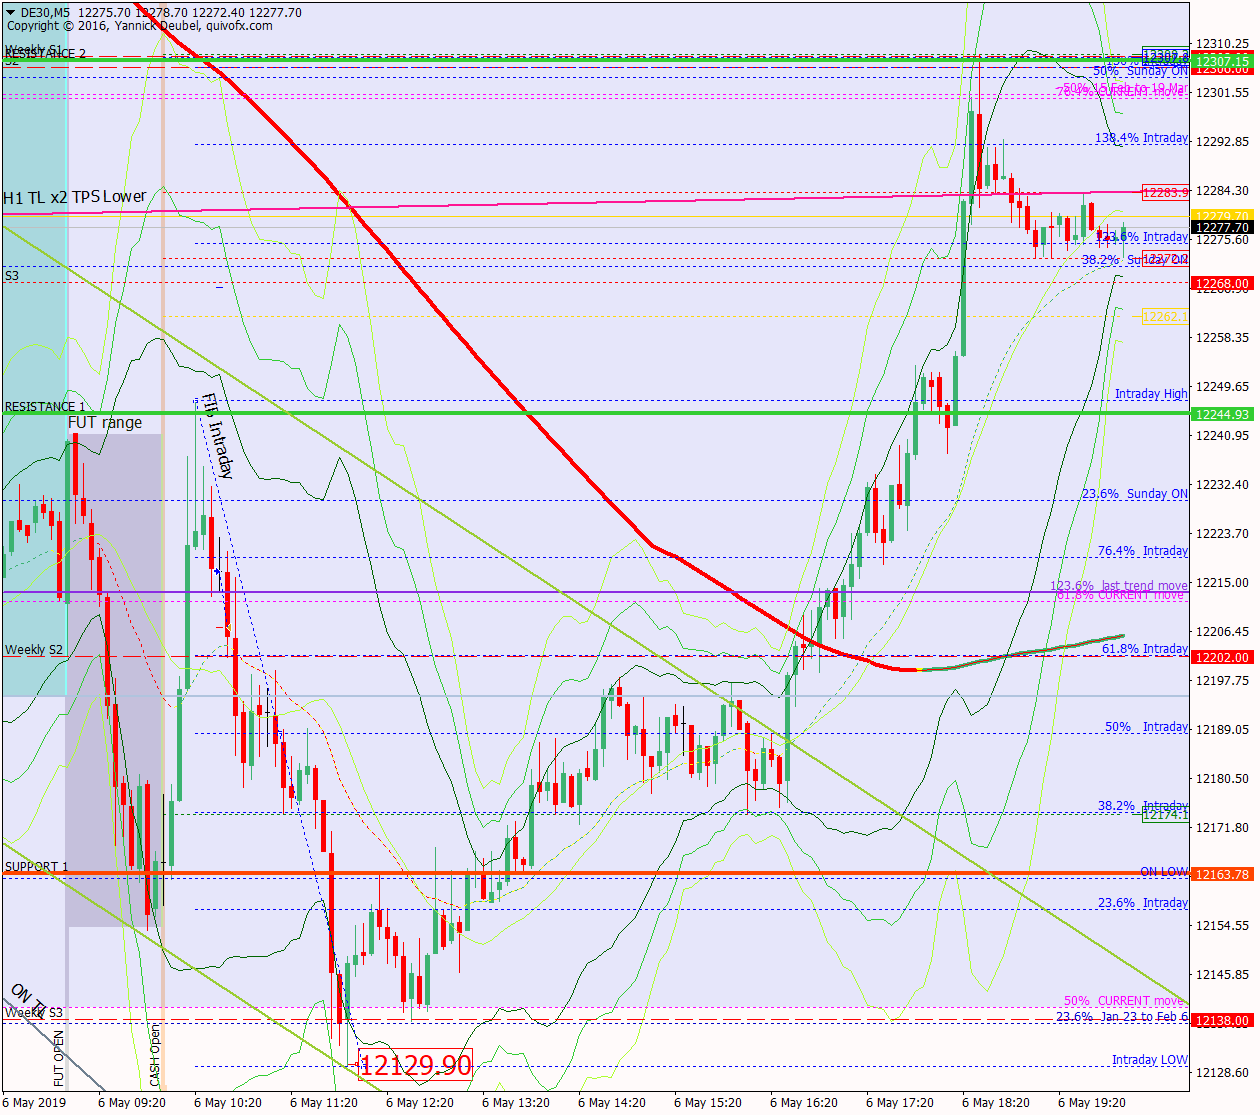
6 May – Washout down to weekly S3 and then recovers 50%+ of the ON losses
6 May 2019Pre-open scenarios
ON, the market opened 123 points lower than Tuesday’s close (the market was closed yesterday for May 1), and this move has broken through important supporting KLs. The market fell through the TL that supported the rising wedge on Monday but did very little with the move and saw a lot of buying into the close on Tuesday. ON, the market regained around 50pts and the futures session has been robust so far, and looks to open to with a gap up. The question is, is this positive move jsu backing and filling from Tuesday’s US session action and the subsequent gap down, or does it mean it’s set for new highs today – especially as it’s the first trading day of the month? The TL that supported the rising wedge will be critical today, as the marekt is well on its way to retesting it – but will it get throgh the many layers of resistance above? Will first of the month buying be sufficient for a break above 12400?


Futures opened at 12313, leaving a gap of +15pts against the cash close and 123 against the futures close. The futures open was within yesterday’s range so there are no ex-gaps.
Physical/body
Sleep – what time did I go to bed? 12:15 so 6.5 hours sleep except that I was up in the night listening to David Bohm
How much coffee have I had? Half medium pot
How do I feel? Slightly resistant and a little fearful
H4 and H1 charts from the morning futures session


Time stamp:
Scenario 1: makes a strong push up to confluence between 12376 and 12388 and then trends down all day – this one is the closest but I underestimated the high and over-estimated the low .. plus it didn’t trendScenario 2: retests 12376 and 12388 and ranges all day between 12376 (high) and 12266 (ON low, CBOS and S1)Scenario 3: makes a couple of tests of 12400 area and higher low after each one, and then breaks through above 12400 to perhaps accelarate into a blow-off top
What the market looked like at the end of the session

PA during my trading hours

Key points about today's PA and setups that worked
The market was skittish today, but early it respected levels perfectly
- the first move was a pop above the futures high by 6 points
- from there it made a very swift move down to SUP 1
- beneath SUP1 the market formed a small triangle after retesting the close and then that broke upwards, in line with the trend
- in accordance exactly with this type of market (glacier) it bounced from there back to the session high
- the retrace this time was much smaller and the market started to tighten above the close, pivot and TLs
- after about half an hour of to-ing and fro-ing, the market broke up to make a new HOD at 12404
- from there, it moved back down to SUP 1, retesting levels along the way
How effective was my Neutral Zone? All PA was within the zone, and there wasn’t any trending action
How precise were my levels? I moved RES 1 to match the futures session high at 12357, which meant that it was a great level to sell at the open, the new level was tested once more for BE the second time and the original level produced 1 +50 and 1+20 ort maybe BE depending on entry. RES 2 was exceeded by 20pts, but from there is sold off and retested RES 1 once in the process.
What I did

TOTAL = -6.8R | # Trades x | Winners 2 | BE 5
Average R per winner = 2.8 | Losses > 1R = 0 | Scratched = 2
R-multiples: trades 2:1 or more = 2 | trades 5:1or more = 1
Outcome using standard TP strategy and same trades
2:1 trades (2R) + 5:1 trades (1 x 2.5R) + BE (0R) + Losses (-11R) = -6.5R
My results vs. SYS = -0.4R
ON TILT trades = 5 (-4.2R)
Rule of 3 trades = 1 (BE)
Scratched trades = 2 (variance vs. rules = -3.2R)
Average coherence 2.7; 20% in green; 35% in red
Today's most gorgeous setup
This chart is assuming I didn’t move my RES 1 – in this case the first sell would have been stopped but the second saw 5:1. The buy from SUP 1 also saw 5:1

For reference: 6 month cash chart at COB yesterday


