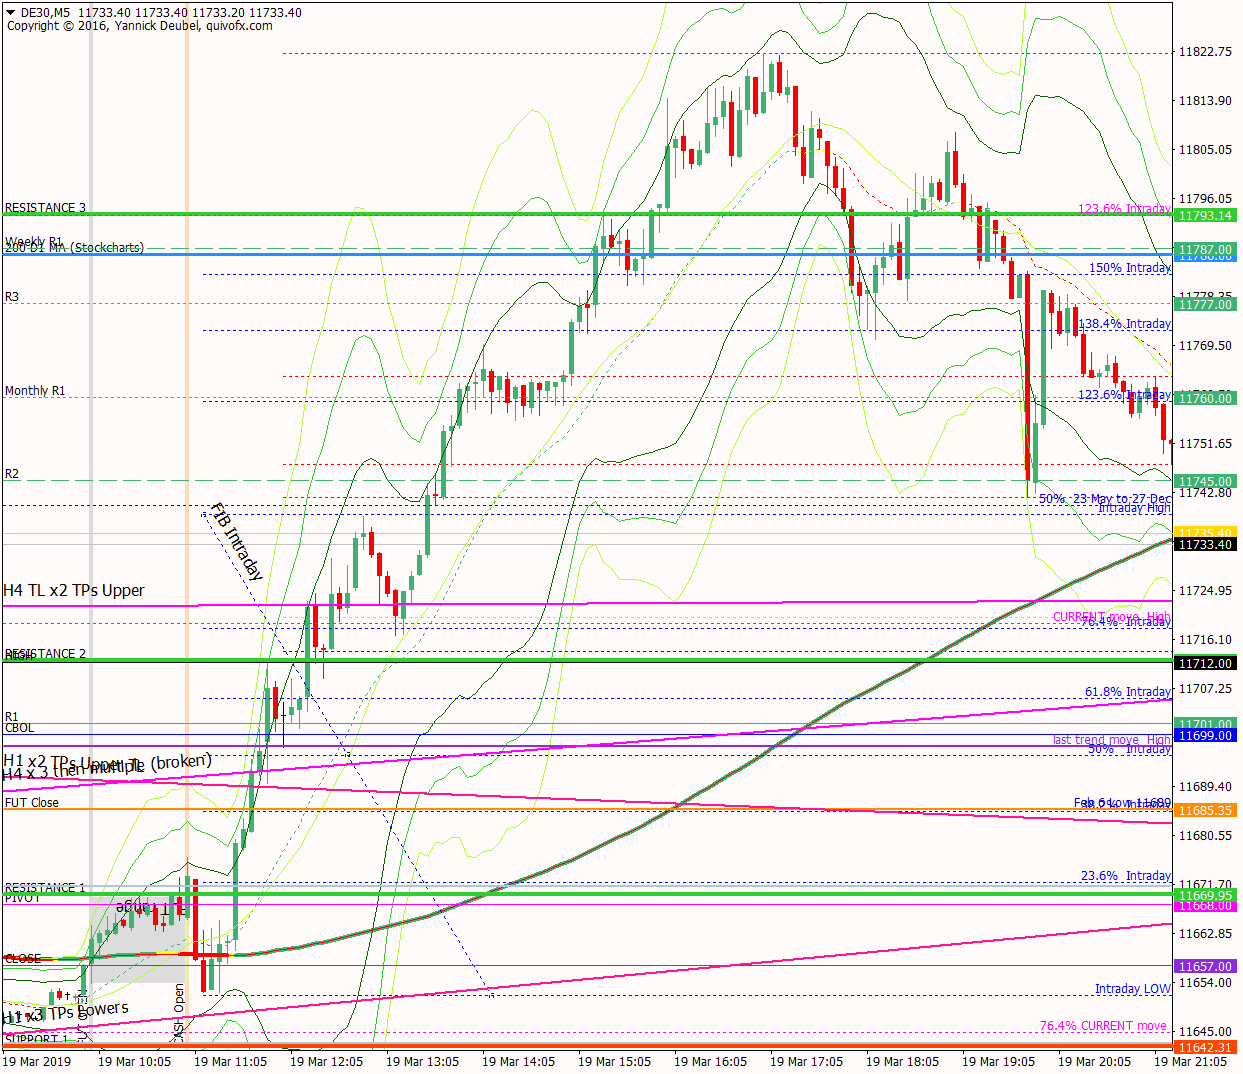
19 Mar – Closes the gap and then steams through levels with hardly a pullback to be seen
19 March 2019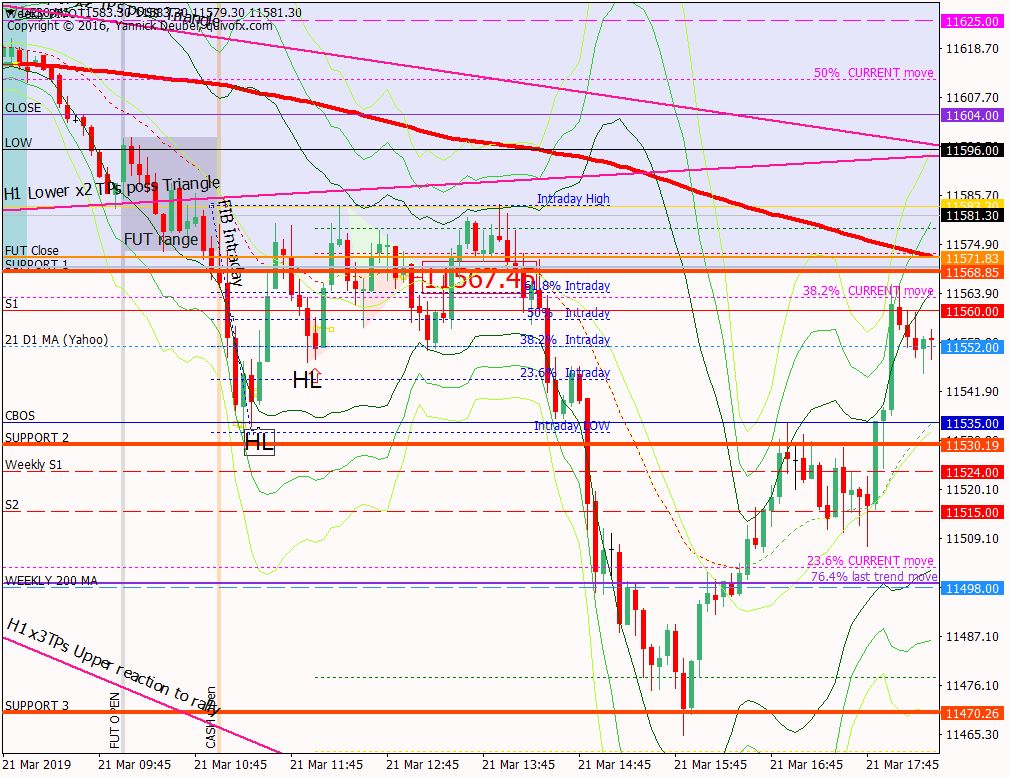
21 Mar – Triangle forms during morning seesion then breaks for 100pts
21 March 2019Pre-open scenarios
Yesterday was a 1% trending up day and the market reached and exceeded the daily cash chart 200MA. The move was strong, with barely a 10pt pull back along the way. However, in the US session and ON it has given back all the gains and returned to the point of origin of the rally. So today the two main scenarios I will be working with are (1) that the ON move is a shake out of all the longs who bought for the 200MA break or (2) it is a genuine reversal, in which case the supporting TL will break in the next couple of sessions and bring about an equally powerful move on the downside. For the market to be positive, it needs to easily regain 11750 area and then close that gap easily.


Futures opened at 11695, leaving a gap of -93pts against the cash close and -52 against the futures close. The futures open was within yesterday’s range so there are no ex-gaps.
Physical/body
Sleep – what time did I go to bed? 23:40 so just about had 7hrs..another half hour would be perfect
How much coffee have I had? None as I am not planning to trade today
How do I feel? Nervous because of gains, really want to finish Edgewonk and posts more than I want to trade
H4 and H1 charts from the morning futures session

The TL marked in blue has been active since the beginning or March. It could easily make a false break and then continue the uptrend, but the moment, prices are moving away from the daily cash chart 200MA so it will be interesting to see if this is just a bout of selling before the market regains that critical level, or if the market’s failure to hold on to the level will lead to more price falls. The declines of December 2018 are now a distant memory and 2019 has been a fairly continuous uptrend, but since the early power seen in January, the increases have been a bit pathetic.
What the market looked like at the end of the session

PA during my trading hours

Key points about today's PA and setups that worked
The undoing of yesterday’s rally in the US session and ON proved to be genuine and the TL I have been watching over the last few days broke
-
the market opened below CBOS but above yesterday’s low, then hit CBOS and made a weak rally to the futures session high
- this was quickly sold and then a triangle formed around the TL and made one false break down to SUP 1 which was swiftly bought but the market didn’t do anything other than get back inside the triangle for about 5 minutes and then it made the break for real
- the break saw 100pts come off the market by the end of the session
- weekly pivot provided a long 3Min Bolli trade and so did S2+2 later in the session
- other than that, the best strategy was to use Imp-Corr structures at levels i.e. SUP 1, y’day Low and weekly pivot
How effective was my Neutral Zone? This was spot on, with a break though the lower bound triggering significant follow-through
How precise were my levels? SUP 1 saw some to-ing and fro-ing but the TLsndother levels were more important. SUP 2 should have been at the weekly pivot to provide a noce 3Min Bolli, but the level was resistance on the nose once the weekly pivot level was broken
What I did

TOTAL = +0.4R* | # Trades 2 | Winners 1 | BE 0
I took a TL break using the EA on the EA account which made 2:1 and the second half of the trade is still open
Average R per winner = 1 | Losses > 1R = 0 | Scratched (loss<1R) = 1
The trade on this account was a mistake
Today's most gorgeous setup
I was waiting for this trade and the triangle gave the perfect entry.
Having decided not to trade today, I then saw the TL break and jumped on board I lost 0.6R on a -1R trade – another example of why trading breaks and reacting to bog bars is loser’s game.

For reference: 6 month cash chart at COB yesterday


