20 Mar – TL cracks and the market loses 100pts
20 March 2019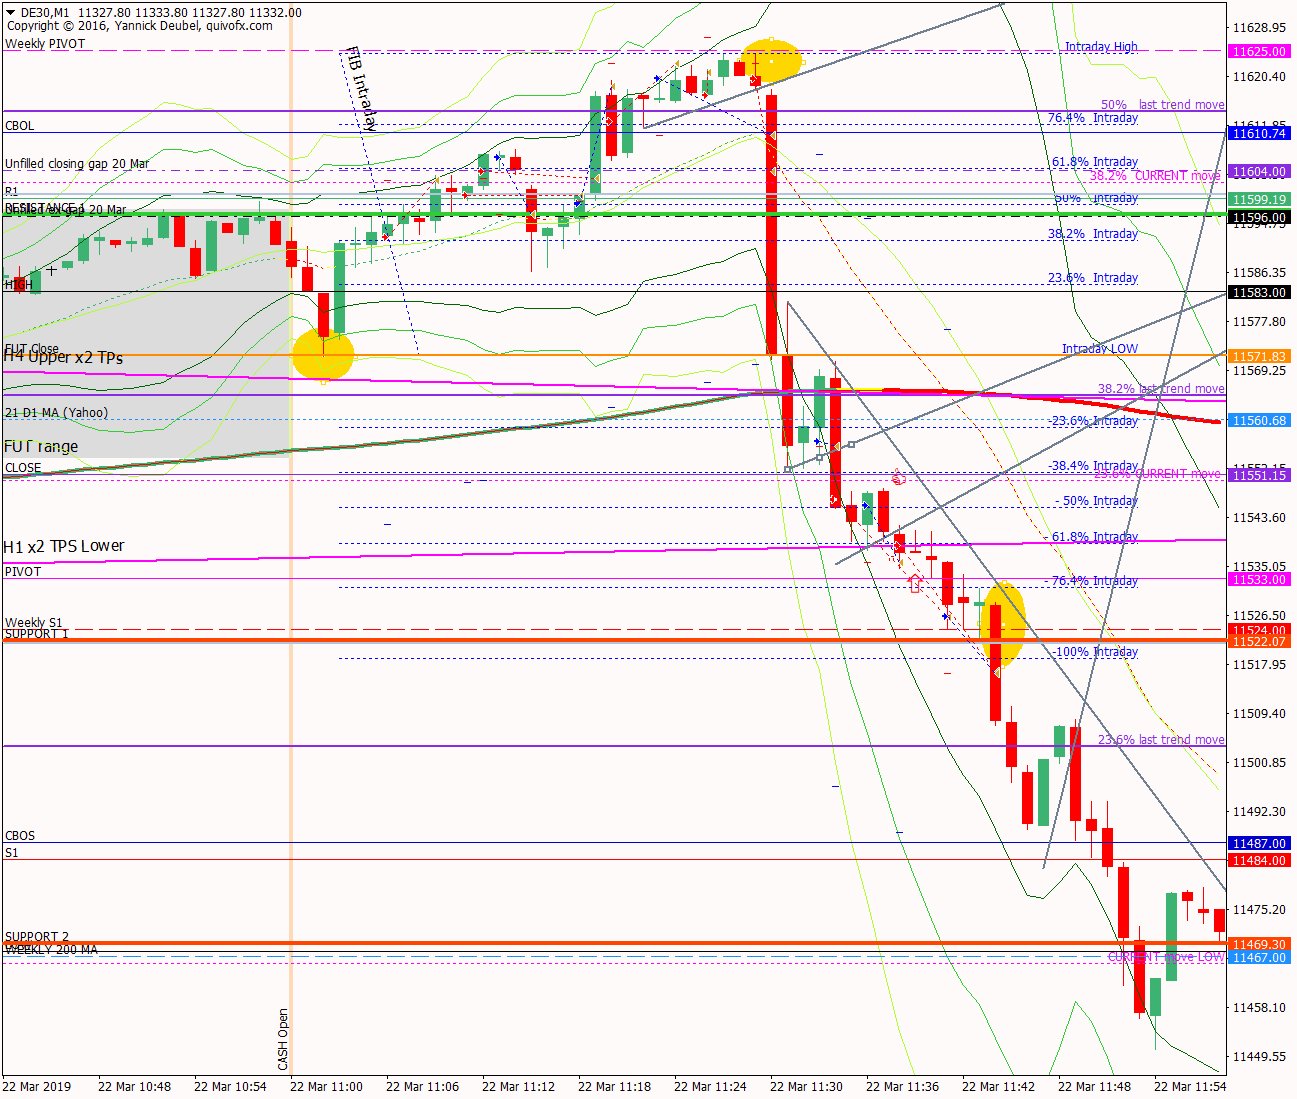
22 Mar – Fills 20th March gaps then crashes through TL
22 March 2019Pre-open scenarios
Yesterday, the TL supporting the March rally broke, taking 60pts off the market. The closing gap didn’t come anywhere near filling (high was 67pts from gap fill) and ON there have been more falls. So where is the market going? There are multiple layers of support between where the market is now and 11500 – and the daily cash chart is at the BNR so that should be a robust level and it’s only 90 pts from the futures open price. On the upside, the market could reverse at the 21-day MA at 11552, which is an area of strong confluence and from there retest the 11630 area.
Overall, from a daily perspective, the market is still in an uptrend so I am neutral on direct today.


Futures opened at 11589, leaving a gap of -15pts against the cash close and +17 against the futures close. The fututres open was below yesterday’s low therby creating an ex-gap of -7pts.
Physical/body
Sleep – what time did I go to bed? 23:15 so I had 7hrs sleep and woke up a few time but slept well
How much coffee have I had? Half an aluminium pot
How do I feel? Good
H4 and H1 charts from the morning futures session

Triangles on the H1 chart are great patterns to trade on the Dax and these are setting up today. But I need to be on toes as a break can swiftly reverse and if it does, there is potential for an R-T-B trade which is one of my strongest setups
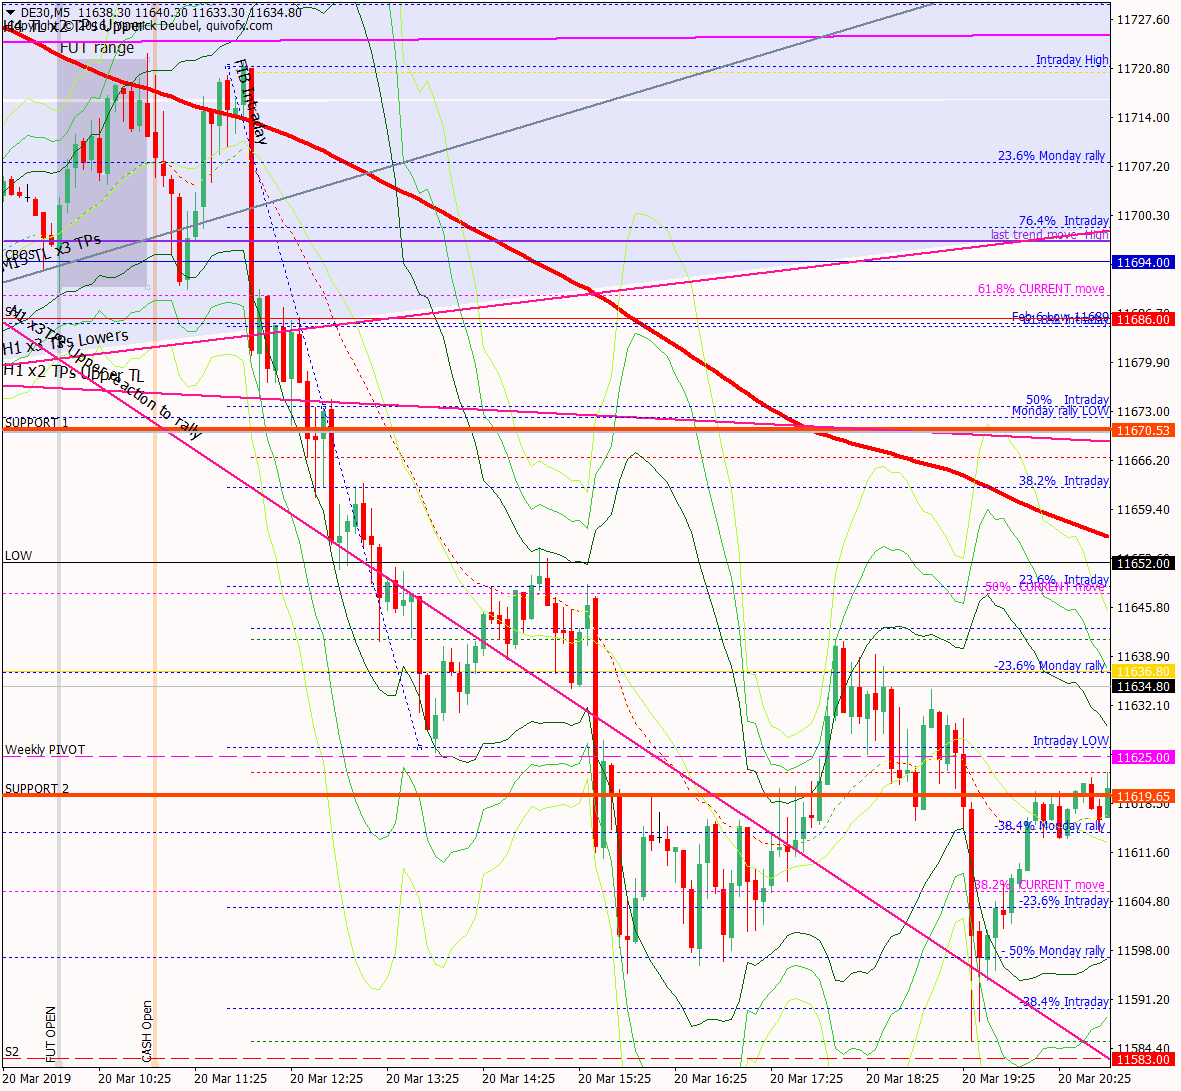
What the market looked like at the end of the session

PA during my trading hours

Key points about today's PA and setups that worked
Apart from the 3MIn Bolli at CBOS, today’s PA required good PA reading skills – especially spotting valid triangles and trading them.
- the market fell away straight from the open and didn’t find enough buyers to stop the falls until it hit CBOS on the nose and from there it created a perfect reversal pattern of short corrective action, HL and then the move
- it then returned to the resistance zone which was around 15pts deep and made up of SUP 1, Fut close and opening high
- this is not nice PA to trade with my setups but using triangles and thinking in zones rather than levels leads to some nice 2:1 opportunities
- during the morning session, the market formed a triangle around the resistance zone
- the first break down from this level made fewer than 20pts and stopped at the 21MA
- the second break saw 100pts come off the market
How effective was my Neutral Zone?
How precise were my levels?
What I did

TOTAL = -2.9R | # Trades 10 | Winners 2 | BE 3
Average R per winner = 1.1 | Losses > 1R = 0 | Scratched (loss<1R) = 0
R-multiples: trades 2:1 or more = 2| trades 5:1or more = 0
Outcome using standard TP strategy and same trades:
(STE at 1:1 50% off at +20 and 50% off at +50)
2:1 trades (2R) + 5:1 trades (0 x 2.5R) + BE (0R) + Losses (-5R) = -3R
Variance vs. SYS = +0.1R
Today's most gorgeous setup
This was a 3Min Bolli at CBOS. It was a 2:1 trade but I could have doubled up on risk uisng a 2nd Chance entry, and 2R with no heat is an excellent result.

For reference: 6 month cash chart at COB yesterday


