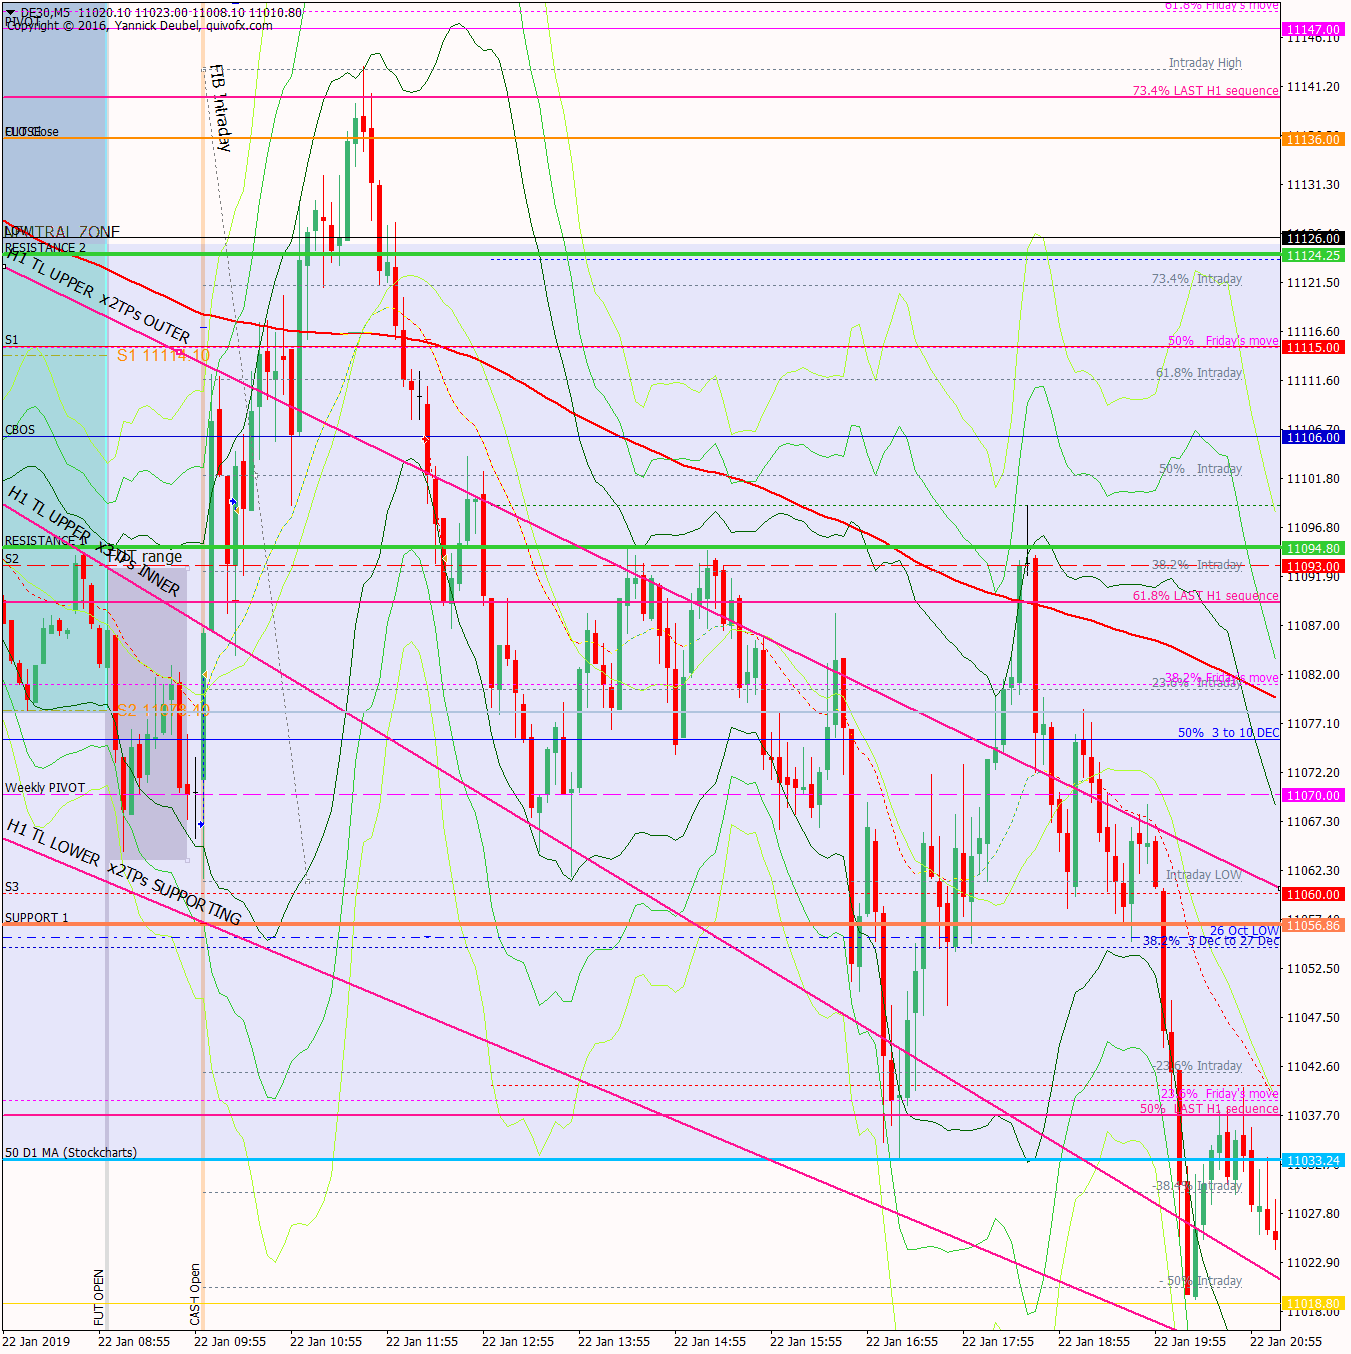
22 Jan – Powerful move up to gap close and then reversal to 50MA
22 January 2019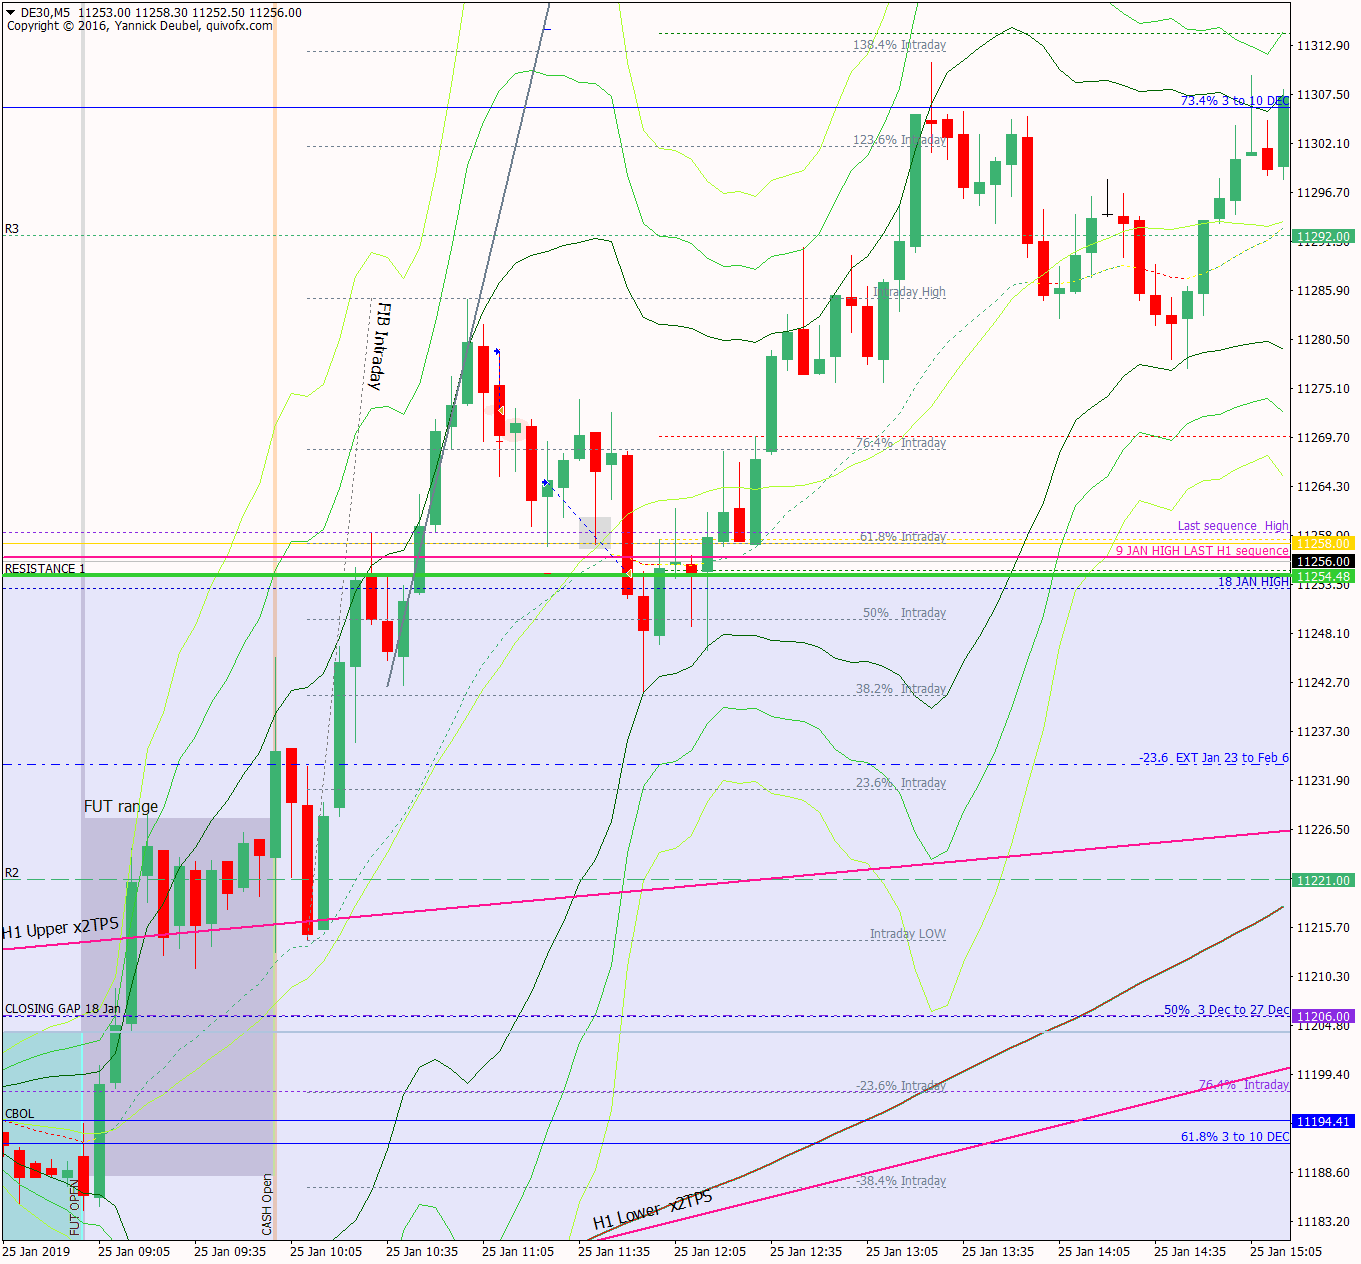
25 Jan – Enthusiastic buyers right from the open, but fails to fill Dec 4 gaps
25 January 2019Pre-open Scenarios
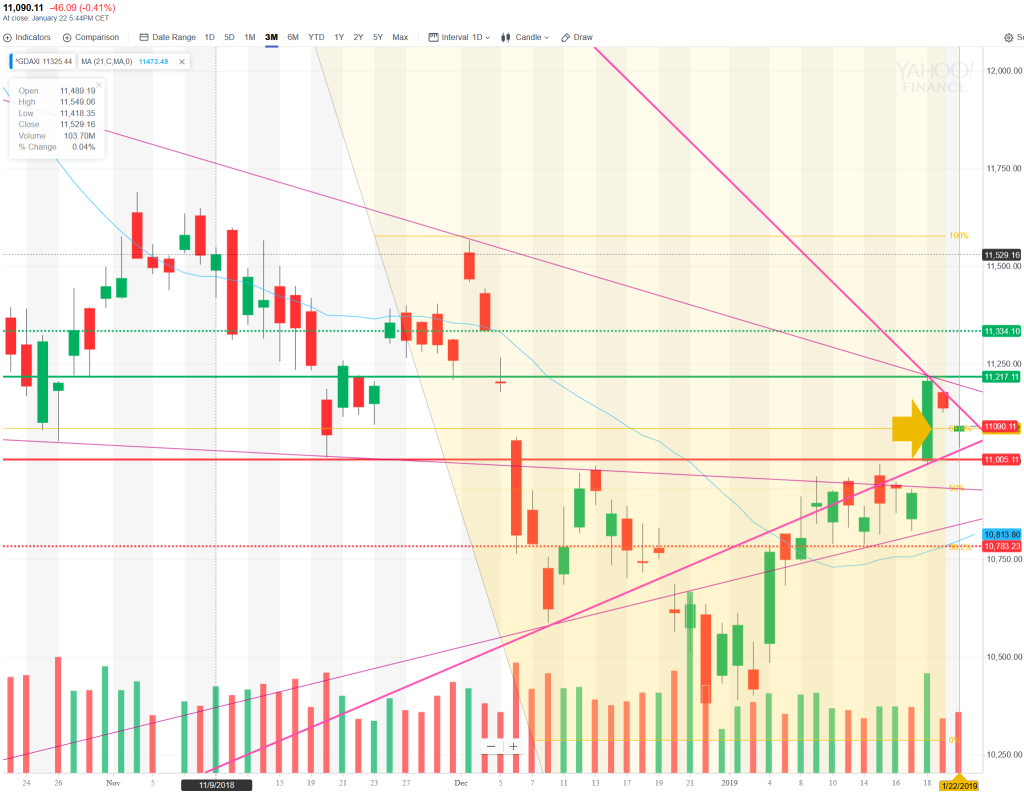
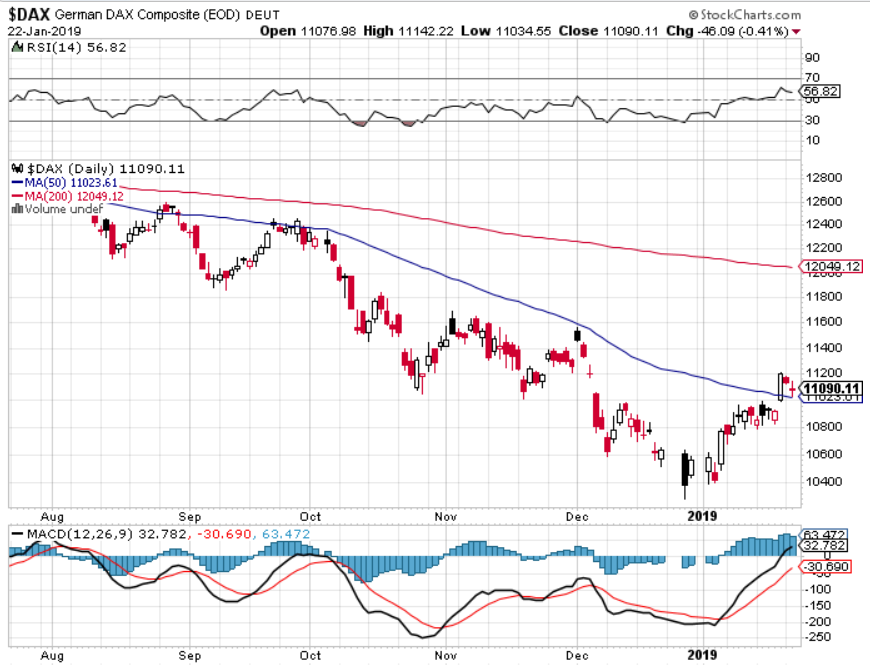
The market is compressing around the level identified yesterday: the 61.8% fib of the Dec 27 to Jan 18 move. This is forming a traingle on the daily chart, albeit one with only 2 touch points on each side. Short-term, the trend is undoubtedly bullish but looking at the 3-month chart, you can see that longer term, it is corrective with a bearish bias. There are still unfilled gaps above – most recently from Friady 18th at 11205, but if the market breaks the underside of the triangle and then yesterday’s lows, then it’s back to 10783.

Futures opened at 11073, gapping 17pts down and 28pts above yesterday’s low. Since then though, the market has sold off and retested the lows.
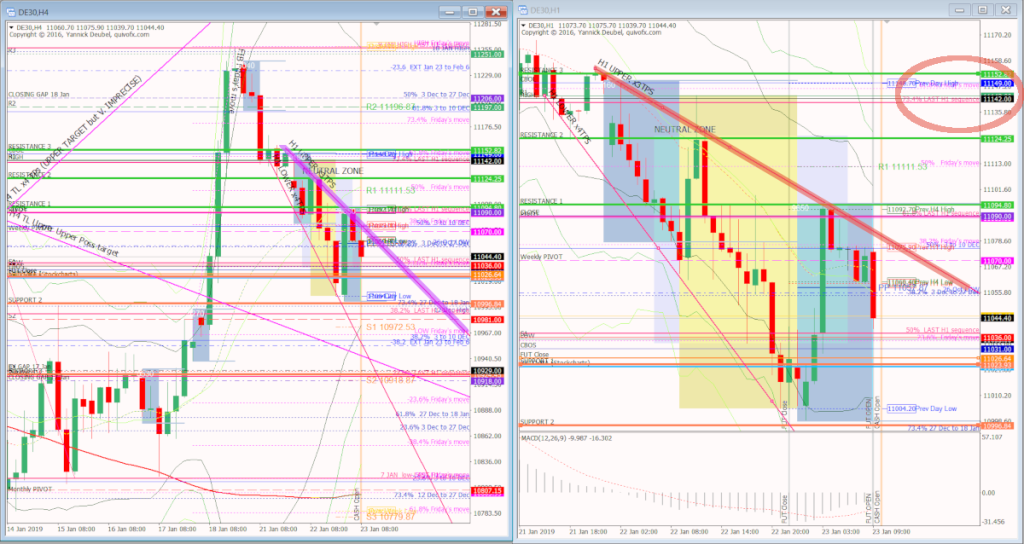
H4 and H1 pre cash open
What the market looked like at the end of the day
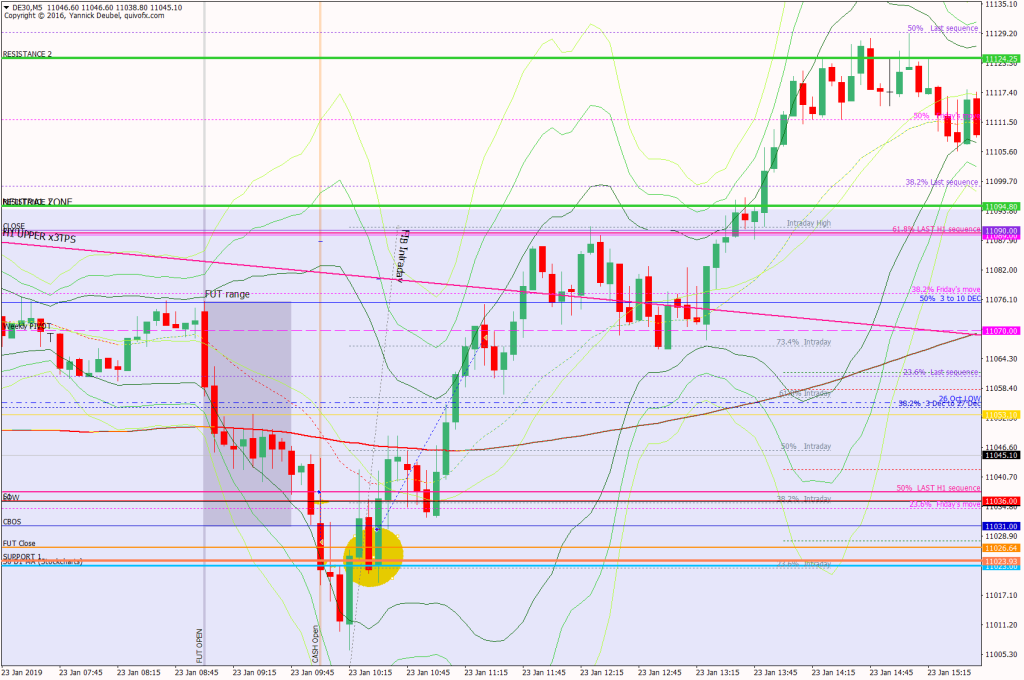
Key points about today’s PA and setups that worked
- The cash open was below CBOS, low and S1 and was therefore categorised as a break out short.
- After a quick fill of the ex-gap, the market continued down and broke the daily cash chart 50MA, retested the level and then moved further down, all of which compounded the bearish picture.
- From 11006, the market reversed to regain the 50 MA and thereafter made a series of HH-HLs while initially respecting levels and the 169.
- The gap close and pivot formed a level of confluence, just above the TL (H4 and H1 charts above) that had been capping this corrective move down; the M15 169 was also around the same level
- Because of this, there was an hour of push-pull action while the market decided whether it would reverse or break through the TL AND above the previous day’s close.
- It chose the break out route and then zoomed up to RES 2 and later in the day moved through before reversing in the evening sessiona nd giving up all gains to close around the 50MA.
How effective was my Neutral Zone? The upper edge was at a previous high, few points above the gap close & pivot level; the points were not relevant to the market, which was using the gap and the pivot as its KL. Once broken, around 30 pts were added to the market. The lower level should have been the daily cash chart 50MA, and my level was not in play,
How precise were my levels? SUP 1 saw a false break below it from where the market made a powerful rally. RES 1 should have been at gap close & pivot rather than above it and RES 2 was spot on.
What I did
TOTAL = -2.6R | # Trades 21 — Winners 7 (33%) — BE 0 —
Average R per winner 1.5 — Losses > 1R
Without management (50pt TP) TOTAL = 8R — Winners 5
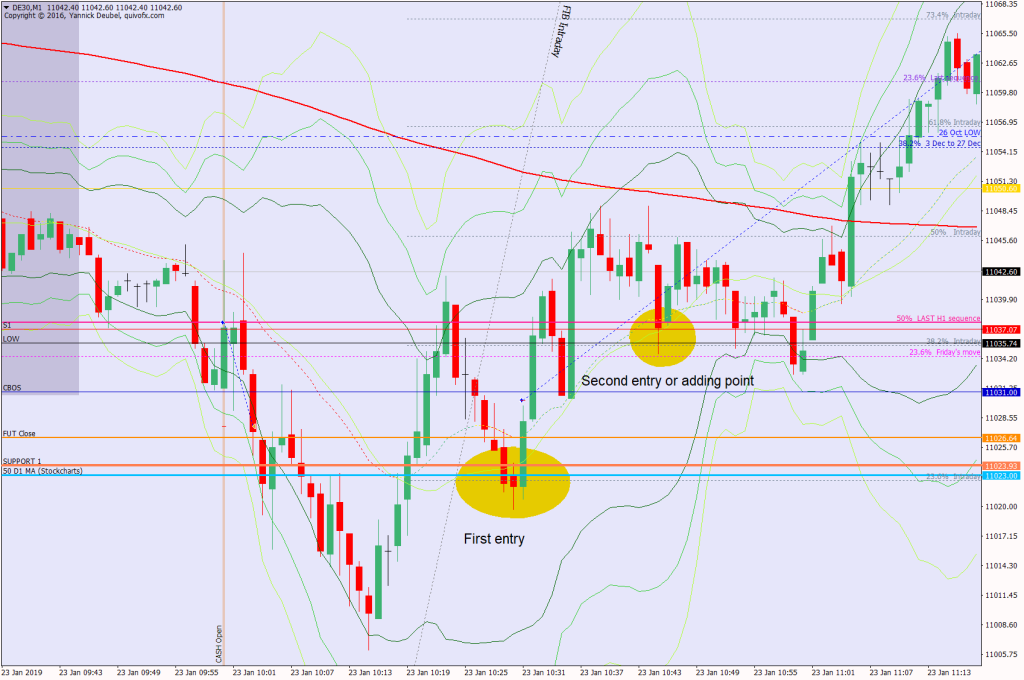
Today’s most gorgeous setup
Buying the break-back-in of SUP 1, the market retested the level after it rejected a move lower which provided an excellent entry. However, it did required buying into CBOS and the market had had a weak tone up until this point, a safer entry would have been above the low, S1 and CBOS and the market retested these levels to provide the entry.
For reference: 6 month cash chart at COB yesterday


