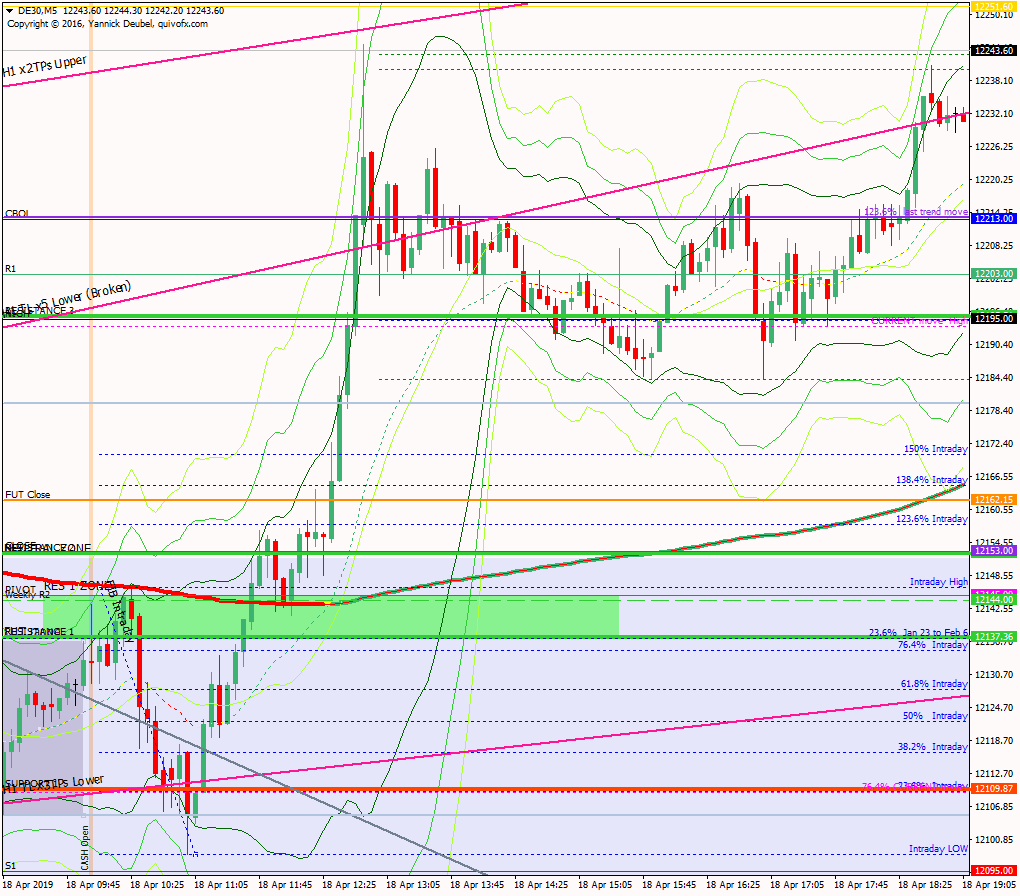
18 Apr – Pops down to BNR then trends up all day to exceed CBOL
23 April 2019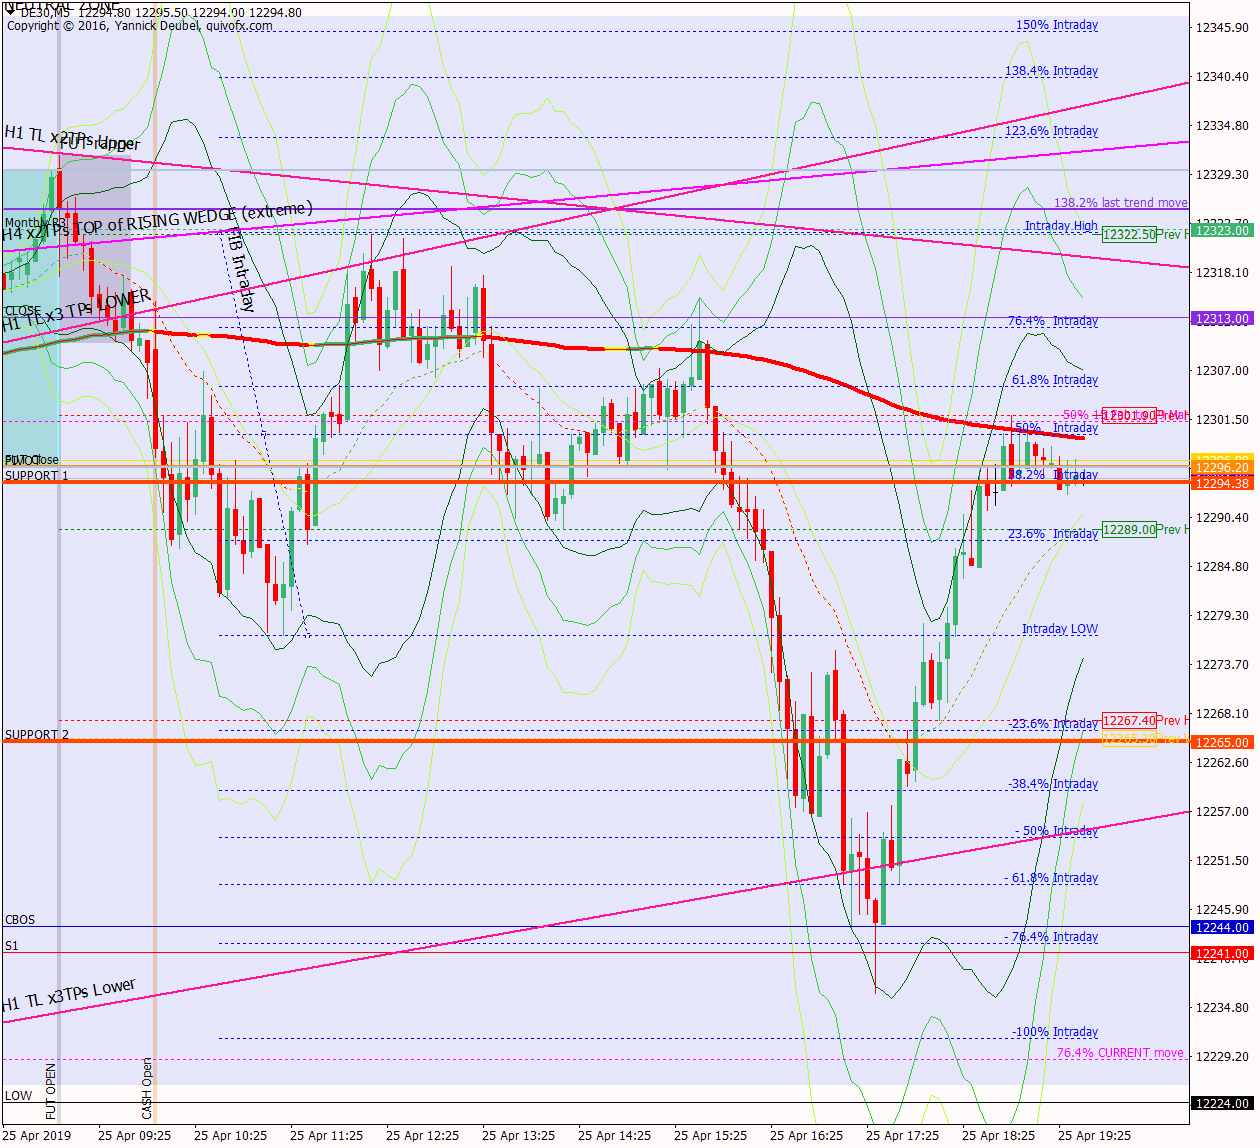
25 Apr – Nothing happened today …
25 April 2019Pre-open scenarios
The market continues to form a rising wedge and the daily cash RSI has been signalling overbought since 17 April. The obvious trade today is to look for breaks of the supporting TL of the rising wedge and breaks of yesterday’s lows; the last time the previous day’s lows were broken was 11th April. So if this level breaks and there is no immediate buying, it could trigger a trend-down day. But what about higher? Where could the market go? The high of this sequence 12264 and above that there is CBOL and R1, so this is a layer of strong resistance and if it does break through, we could see a very energetic thrust up to R3 at 12333


Futures opened at 12210, leaving a gap of -26pts against the cash close and 33 against the futures close. The futures open was within yesterday’s range so there are no ex-gaps.
Physical/body
Sleep – what time did I go to bed? 23:45 so 7hrs
How much coffee have I had? Half a medium pot
How do I feel? Interested in truth, free from ‘must change’ project
H4 and H1 charts from the morning futures session


Timestamp: 8:28
Scenario 1: goes up to fill gap at 12236 – or maybe up to retest high and TL – and then declines throughout the day towards S2
Scenario 2: moves lower at the open to retest lows and then goes on to make new highs; the move down could even extend to 73.6% of the current move at 12162 and S2 is at 12155 – close didn’t make it as far as the lows
Scenario 3: opens weak and trends lower all day, and the trend speeds up once it’s broken yesterday’s lows and seen acceptance there
No scenario for up at the open and continuing up? – it didn’t do that..
What the market looked like at the end of the session

PA during my trading hours

Key points about today's PA and setups that worked
As expected the market dipped down at the open but only down to the pivot (which was also the 169 on the M15 chart) and then it went on to make new highs
- the opening move was to power through the cash and futures gaps and to retest yesterday’s high
- there were plenty of sellers at the high and they managed to drive the market back down to the pivot in a single swift move
- this area was ripe for a with-trend reversal and from there the market gained 1%
- after a shallow pullback at the high, it then exceeded it and extended out of my Neutral Zone in doing so
- from there it R1 which was also the current move high
- there was a bit shuffling back and forth below this level and then a huge bar came out of nowhere – at exactly 10:00, a huge sell order appeared which engulfed the previous 30mins of PA
- the bar saw a small retrace to fut close level but then gradually worked lower to the M1 169 and intraday TL
- from there it formed a series of HLs but the fut close and H1 TL held it at bay on the upside
- … until they didn’t and the market broke up to new highs in a strong trending with barely a pullback at KLs
How effective was my Neutral Zone? The upper bound of the Neutral Zone was yesterday’s high and this held early on in the session – producing a nice counter-trend short, but once the trades had been placed there and the market had moved lower to collect orders, the level became irrelevant
How precise were my levels? RES 1 was competely powerless at the open as the market burst through gap fill to test the high – but it did provide a precise retest level later in the session with bull candle forming at the level before it made its break; RES 2 was spot on and RES 3 didn’t have any impact at all.
What I did

TOTAL = +0.9R | # Trades 21 | Winners 5 | BE 5
Average R per winner = x.x | Losses > 1R = x | Scratched = x
R-multiples: trades 2:1 or more = 5 | trades 5:1or more = 2
Outcome using standard TP strategy and same trades
2:1 trades (5R) + 5:1 trades (2 x 2.5R) + BE (0R) + Losses (-11R) = -1R
My results vs. SYS = +1.8R
ON TILT trades = 4 (-3R)
Rule of 3 trades = none
Scratched trades = 1 (variance vs. rules = +0.5R)
Today's most gorgeous setup
Short description

For reference: 6 month cash chart at COB yesterday


