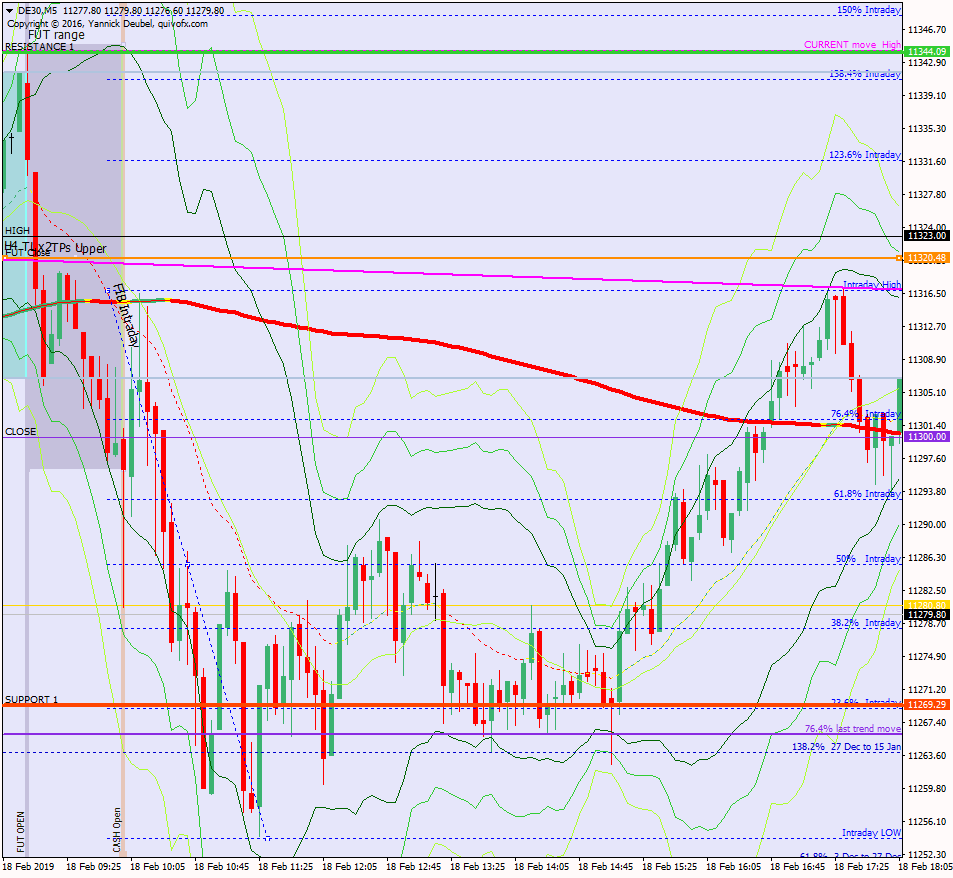
18 Feb – Market doesn’t want to retrace
18 February 2019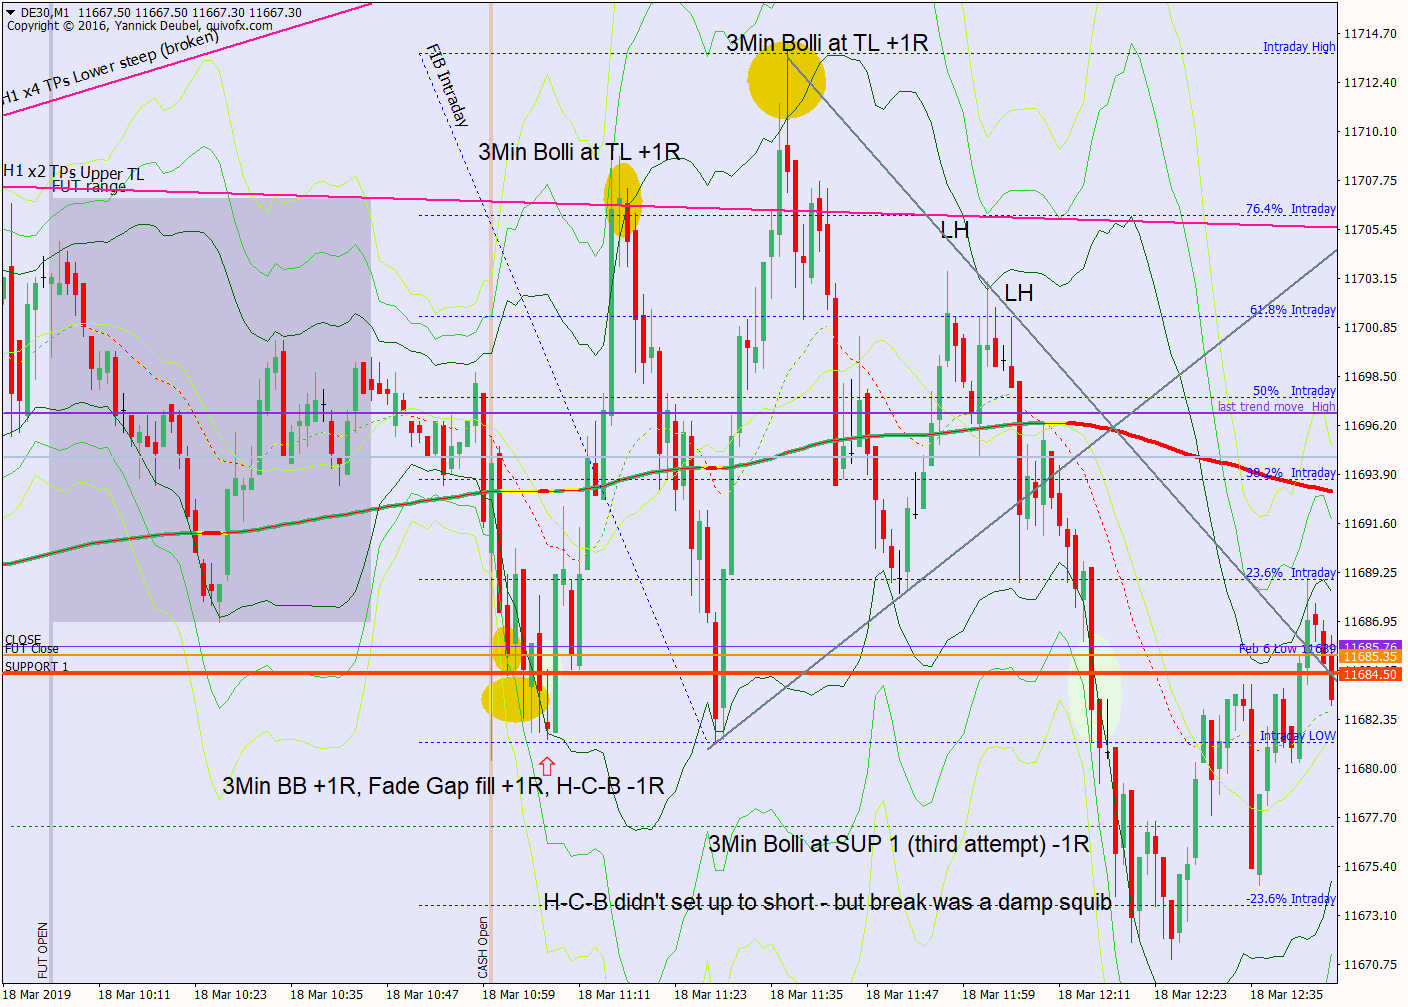
18 Mar – Slow, slow but drift was lower
18 March 2019Pre-open Scenarios
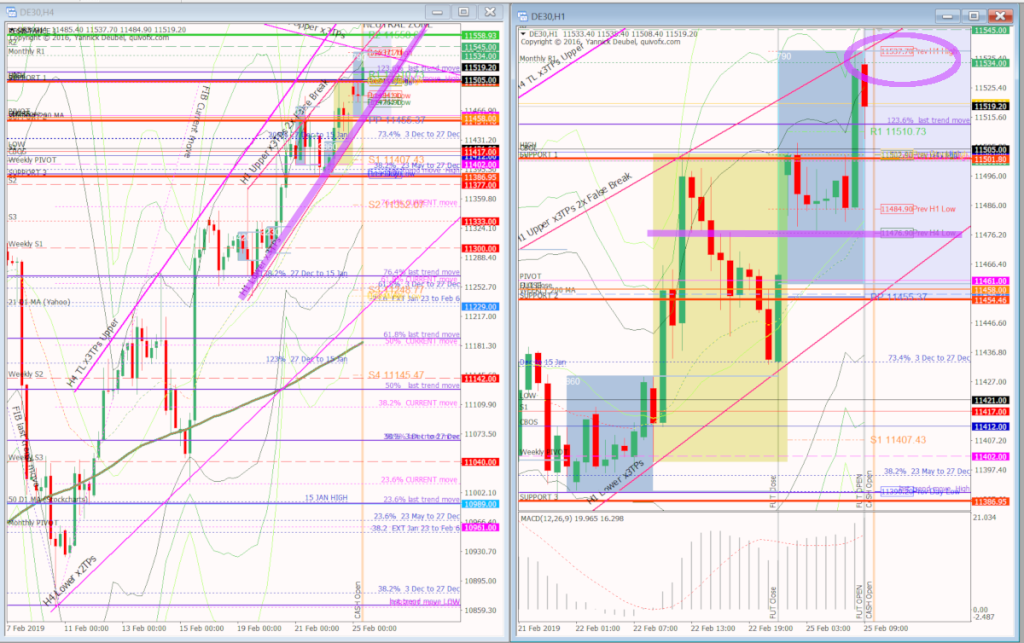
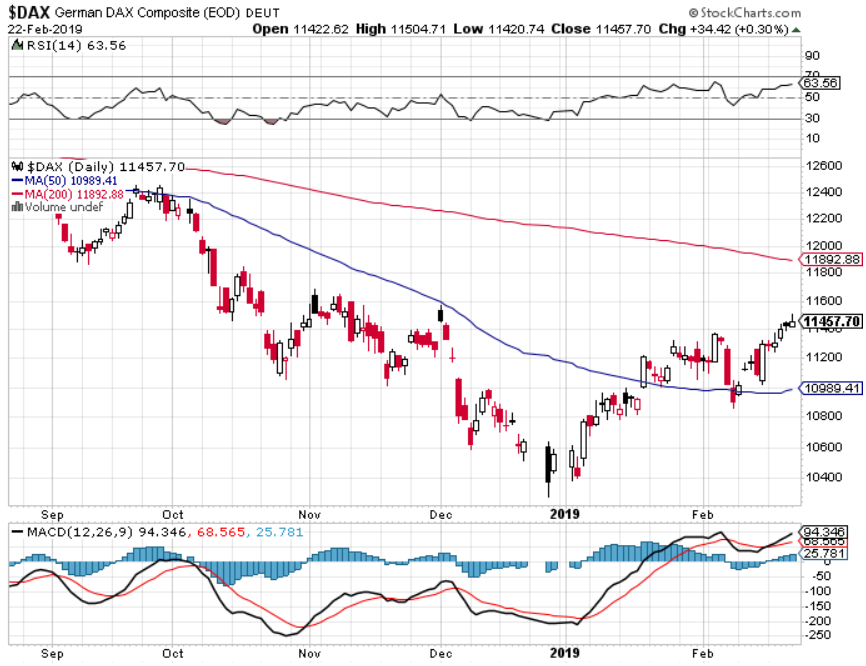
The market has now filled all gaps left from early December, so it has no more reason to continue its move up, unless we have a new uptrend at hand. The Weekly 50MA is at 11457 and this level will be critical this week: if the market finds support there, we will see another leg up to around 12,400. There is also a long term TL at Friday’s high and a previous swing high at 11565 (Dec 3)
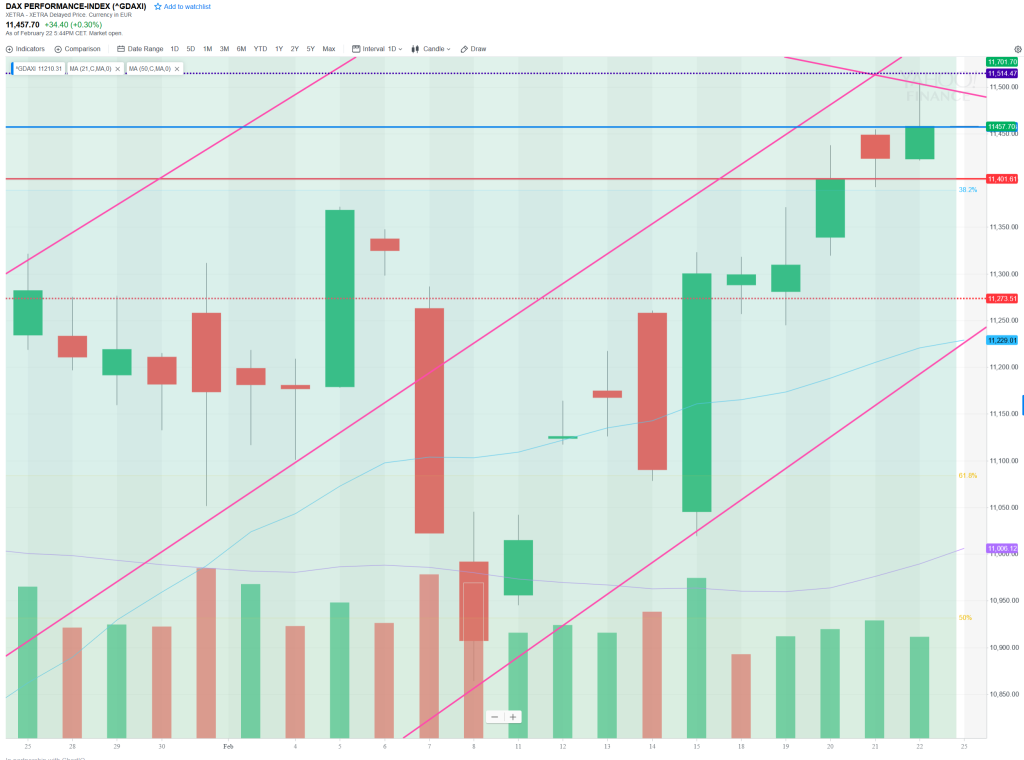
Futures opened at 11533 leaving a gap of +75pts against the cash close and +71pts against the futures close. The futures open created an ex-gap of +18pts.
Body
Sleep – what time did I go to bed? 10:40 and then I watched Netflix until around 11:10. Sleep was interrupted and I was mourning my money (again).
How much coffee have I had? Half a medium pot.
How do I feel? Am I going to win today? Very aware of the extent to which my survival feels under threat.
H4 and H1 charts from morning futures session
What the market looked like at the end of the day
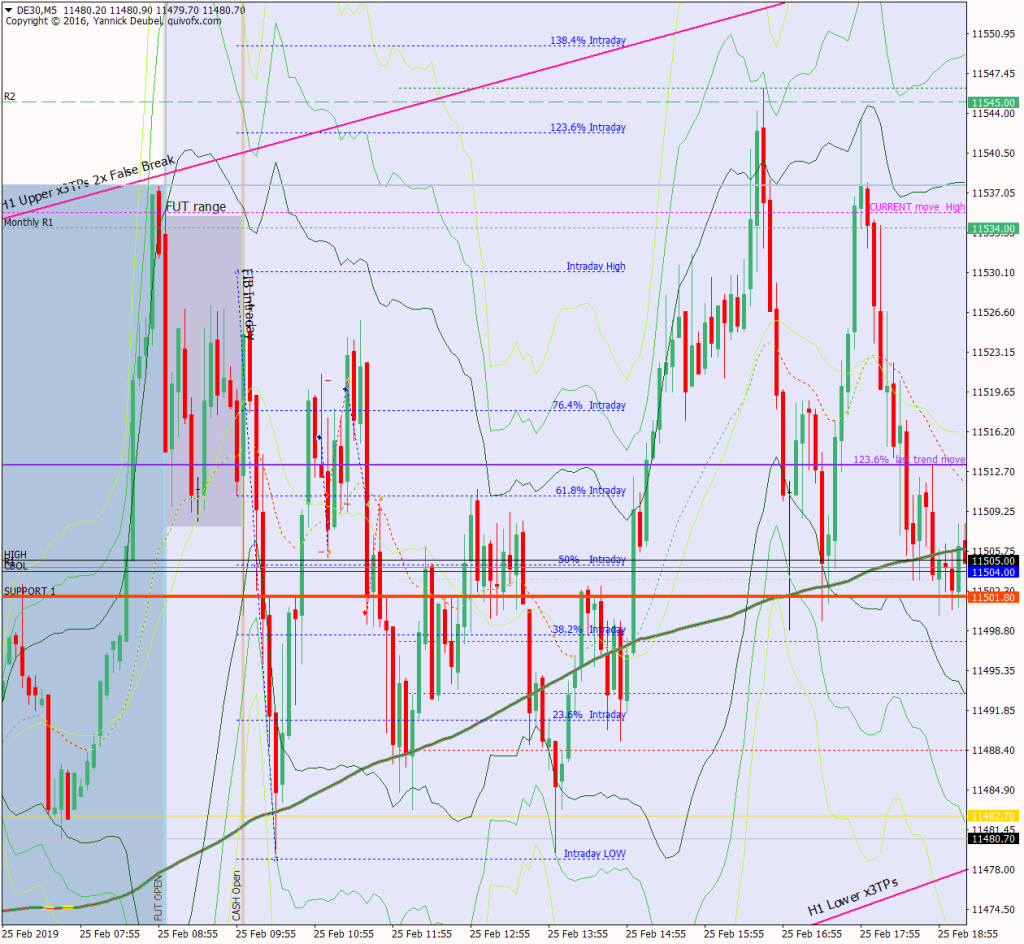
Key points about today’s PA and setups that worked
It is interesting to look at this chart and see the power of the M5 169 MA
- the 3Min Bolli trade worked very well at the open as the market spiked in both directions
- CBOL/R1/y’day High which was my SUP 1 was a level to trade as a breakout – although in both directions it only made 20pts before reversing
- the 5-day ATR was only 126 today and range during the morning session was only 50pts – meaning that to get a +20, I have to get nearly 50% of the range and to get a +50 … nearly impossible except that my sell at 10:04 hist +48 before reversing.
- although it’s not marked on the chart, a clear downward sloping TL formed during the morning session which was the upper edge of a triangle, the bottom of the triangle was the ON low
- break out of the triangle was just about 50pts and hit R2 on the nose
How effective was my Neutral Zone? Neither bound of the zone was in play; on reflection, R2 would have been the correct level for the upper bound but mine was at the previous KSP (key swing point)
How precise were my levels? SUP 1 made perfect sense but it was a more a level to trade breaks of the level rather than reversals off it. The intraday low, and the best reversal level was the ON low, but I missed this.
What I did
TOTAL = -7.8R | # Trades 16 | Winners 2 | BE 4
Average R per winner = 1.1 | Losses > 1R = 0 | Scratched (loss<1R) = 1
R-multiples: trades 2:1 or more = 2 | trades 5:1or more 1 = 0
Outcome using standard TP strategy and same trades:
(STE at 1:1 50% off at +20 and 50% off at +50)
2:1 trades (2R) + 5:1 trades (0R) + BE (0R) + Losses (-9R) = -7R
Variance vs. SYS = -0.8R
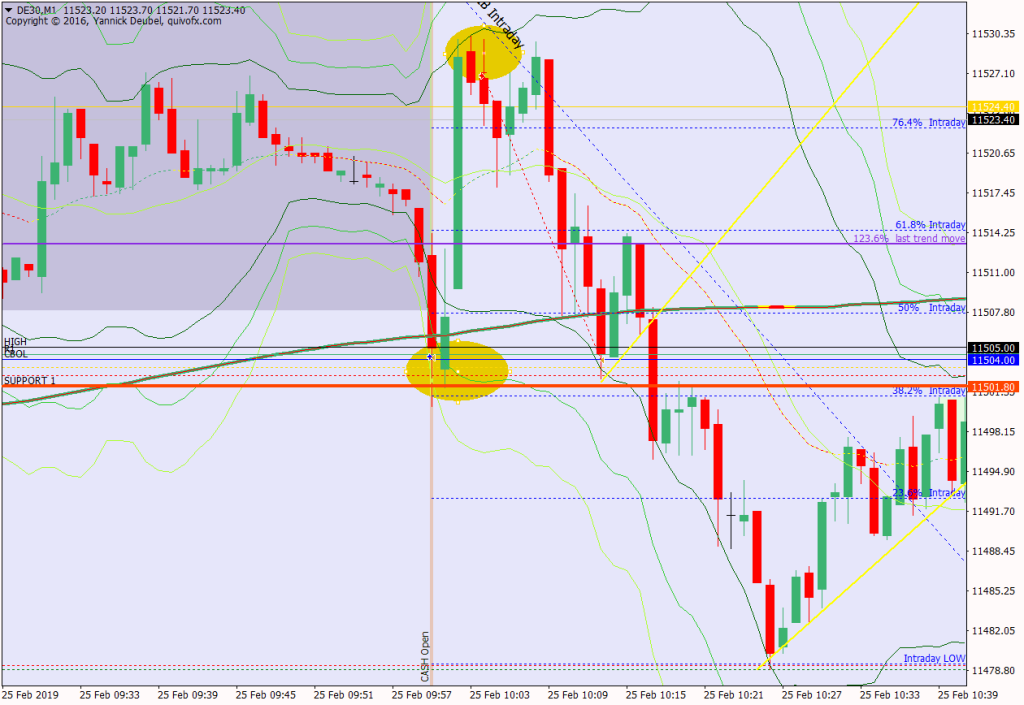
Today’s most gorgeous setup
These two trades set up so close together that I will describe them as one. The first was the dip down to SUP 1 outside the 3Min Bolli so it was a buy and the second was a sell on the same logic – a fast move to the ON high and TL (appeared on only on M15) in the 2nd minute. I could then add to the sell using H-C-B structure.
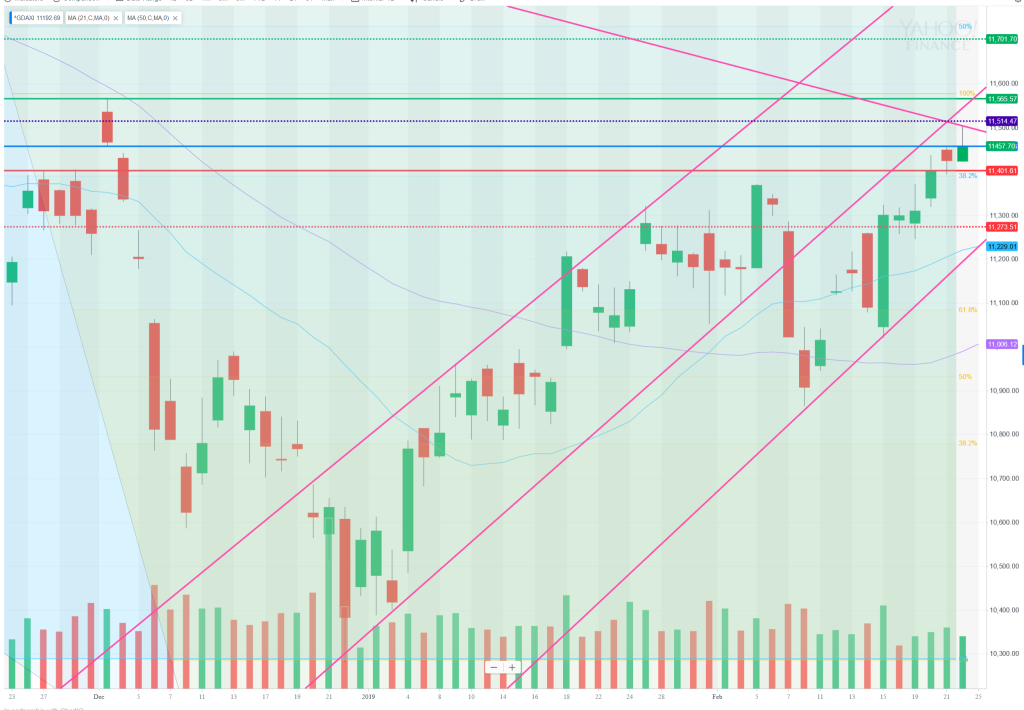
For reference: 6 month cash chart at COB yesterday


