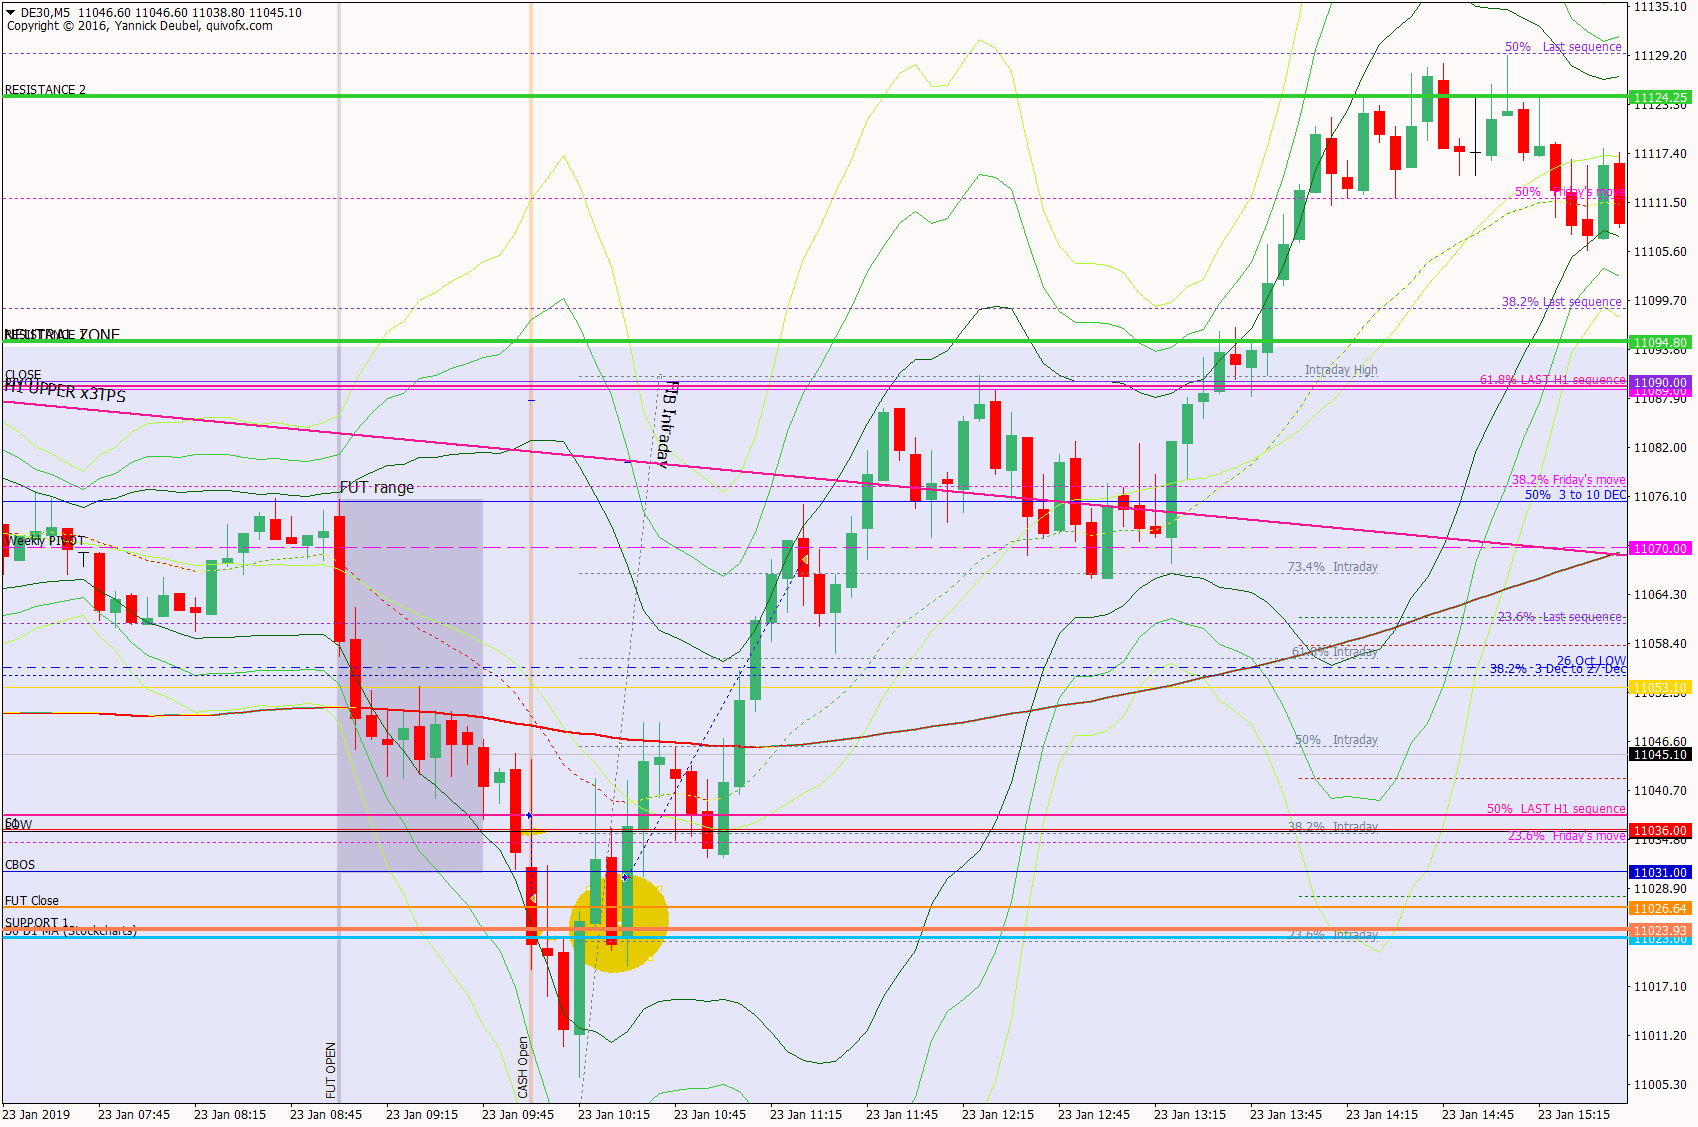
23 Jan – Rinse and repeat, closes gap plus a bit more and then sells off
24 January 2019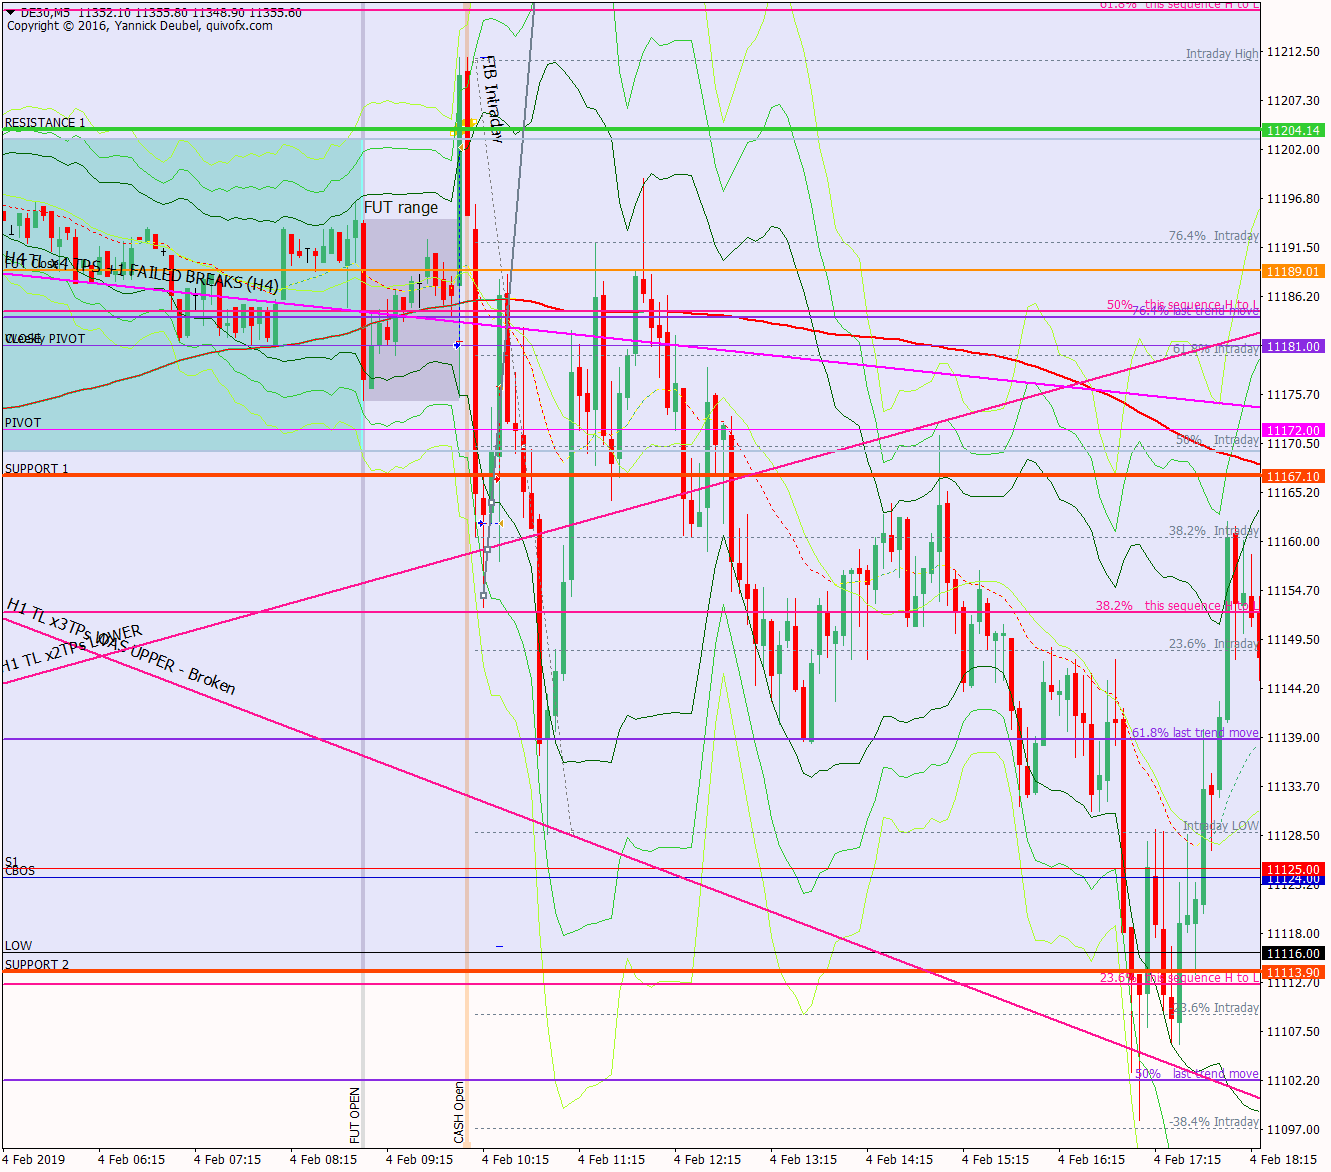
4 Feb – Breaks supporting TL but reverses straight back up again
4 February 2019Pre-open Scenarios
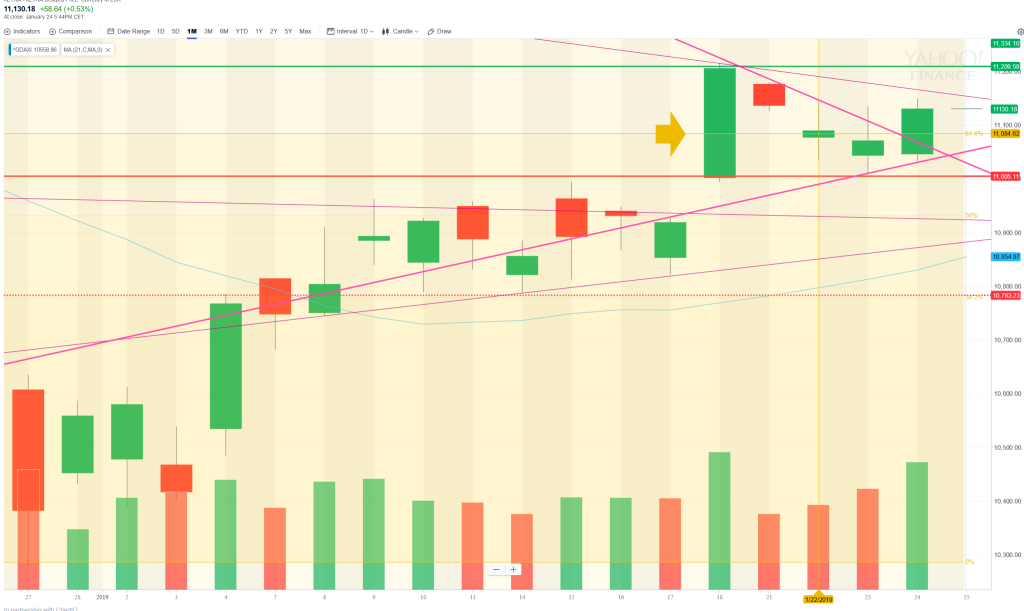
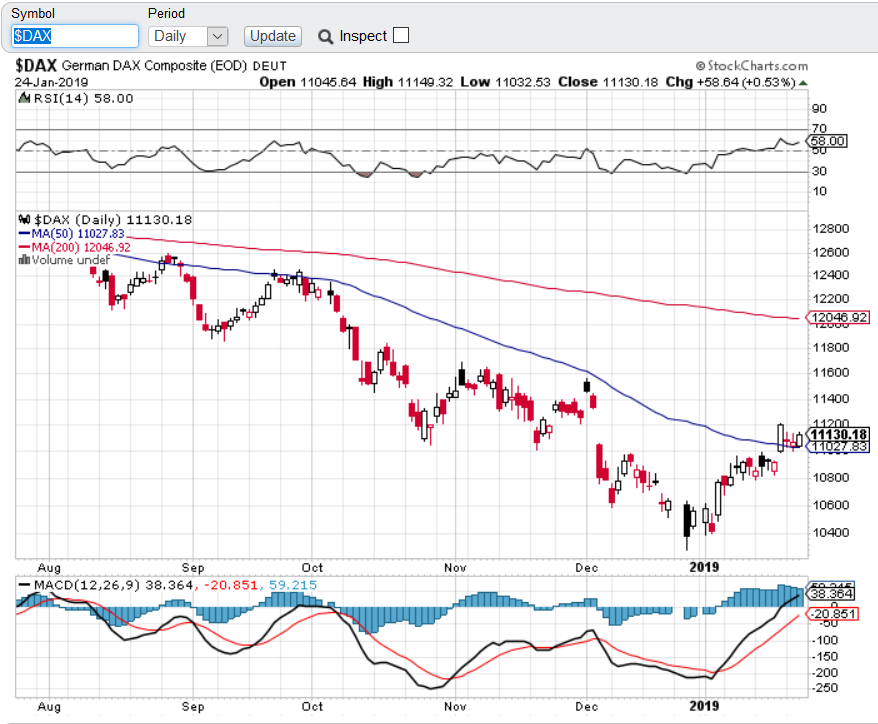
I wasn’t trading yesterday but I see that the triangle I identified on Wednesday broke to the upside and is heading for at least 11205 which is the gap from 18th Jan and then 11243 which is the futures session high from the same day. There are unfilled gaps above at 11335 and then 11465, so if we see action above 11205 today, then I need to get long and so that I am on board for the ride up to to the gaps fills. Alternatively, there are some nice, clear TLs forming that support this move up and if they break, we will resume the downtrend. Despite January’s amazing bullishness, the market is still in a long term downtrend, which is clear from the 6mth chart at the bottom of the page. However, it has now regained the daily cash chart 50MA, so this could be the start of a new upward phase.
Futures opened with a 60pt gap up at 1190. The cash market opened at 11233 (103pt up gap).
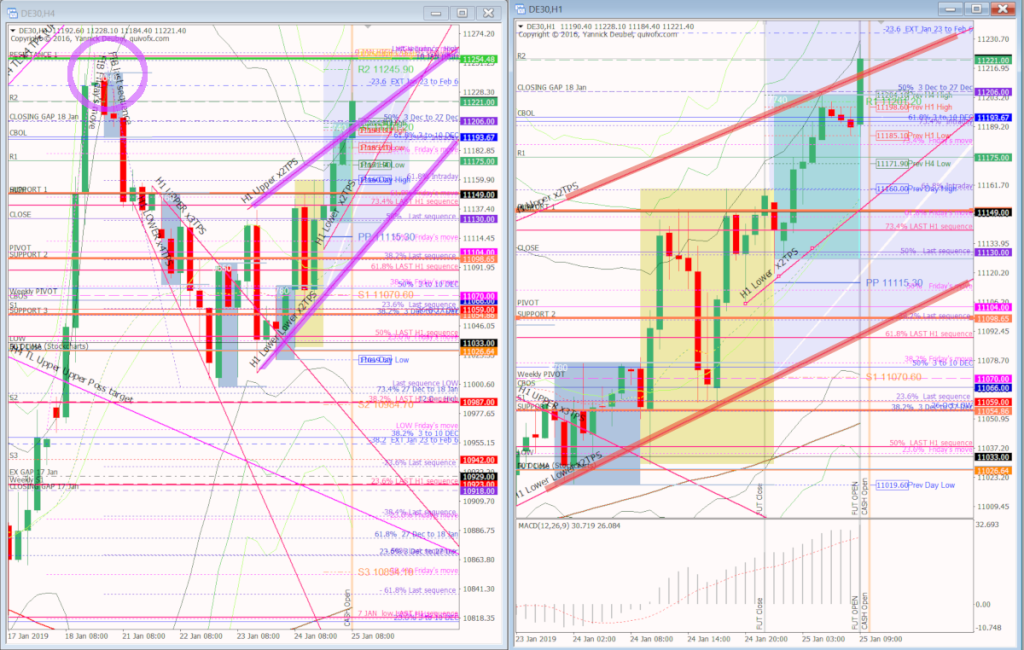
H4 and H1 for metatrader
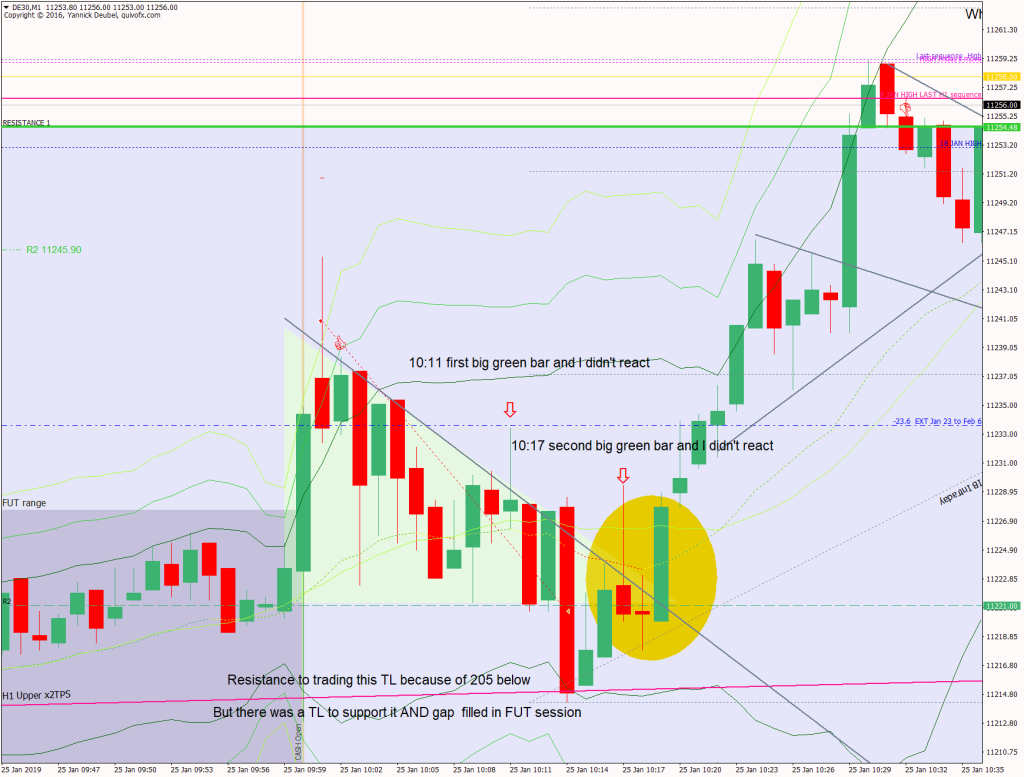
What the market looked like at the end of the day
Key points about today’s PA and setups that worked
- The futures opened with a gap up of 60pts and extended gains during the session; the PA showed that the upper TL containing the rising wedge was in control.
- Cash opened with a 103 up-gap, dipped juts below R2 down to the TL and then never looked back.
- RES 1/upper edge of Neutral Zone saw a very shallow retrace so soon broke through to make an attempt on R3.
- After failing to hit R3, the market retraced to 38.4% on the nose (which was also the M1 169 and then hit R3, made another shallow retrace and continued upwards.
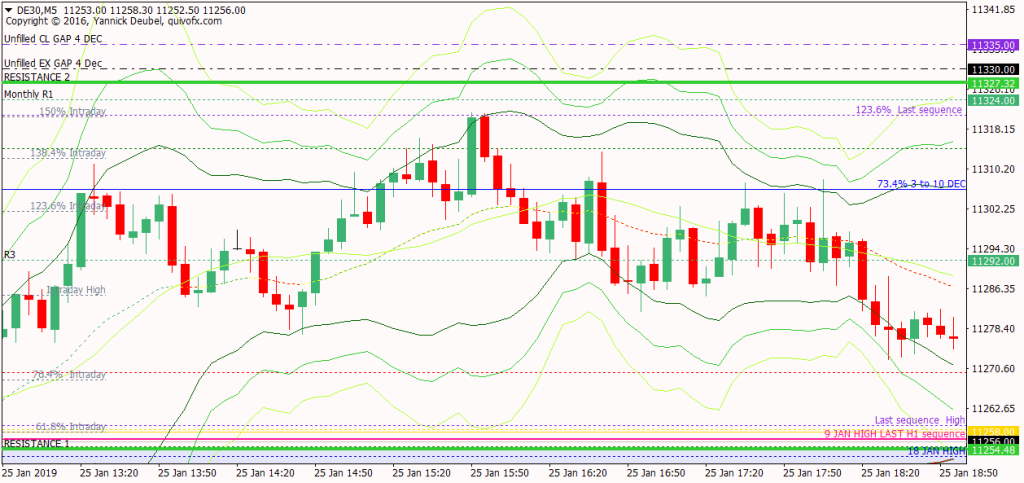
- After a doji at 76.4% the 3 to 27 Dec move, the market came down to retest the day’s first peak around 12285.
- From the bounce off there, it seemed inevitable that the market would fill the gaps from 4th Dec at 12330 (ex-gap) and 1335 (closing), but it didn’t
- The reversal came at the 1505 fib ext from the session’s first push which was also the 123.6 fib ext. of the most recent push up (22nd Jan futures evening session low to today’s futures session high). Of this can always be a co-incidence but these fib extensions seem to be very good KLs.
How effective was my Neutral Zone? The upper edge was quite accurate; the first touch was rejected and the second broke through to reach R3 -7. From there it retested and the second time it broke up way beyond R3. The retest went further than back inside the Neutral Zone and down to the M1 169. The lower edge wasn’t in play.
How precise were my levels? RES 1 is as above and the first push into it setup as a 3Min Bolli that failed. RES 2 was the unfilled gaps from early December but it seems (see chart above) that fibs were more in control.
What I did
TOTAL = -5.3R | # Trades 16 | Winners 3 | BE 4
Average R per winner 1.3 — Losses > 1R 0
Trades 2:1+ 2 Trades 5:1+ 1 —-
Outcome using standard TP strategy and same trades:
(STE at 1:1 50% off at +20 and 50% off at +50)
3.5R + 2x 1R + 4x BE + 9x -1R = -3.6R
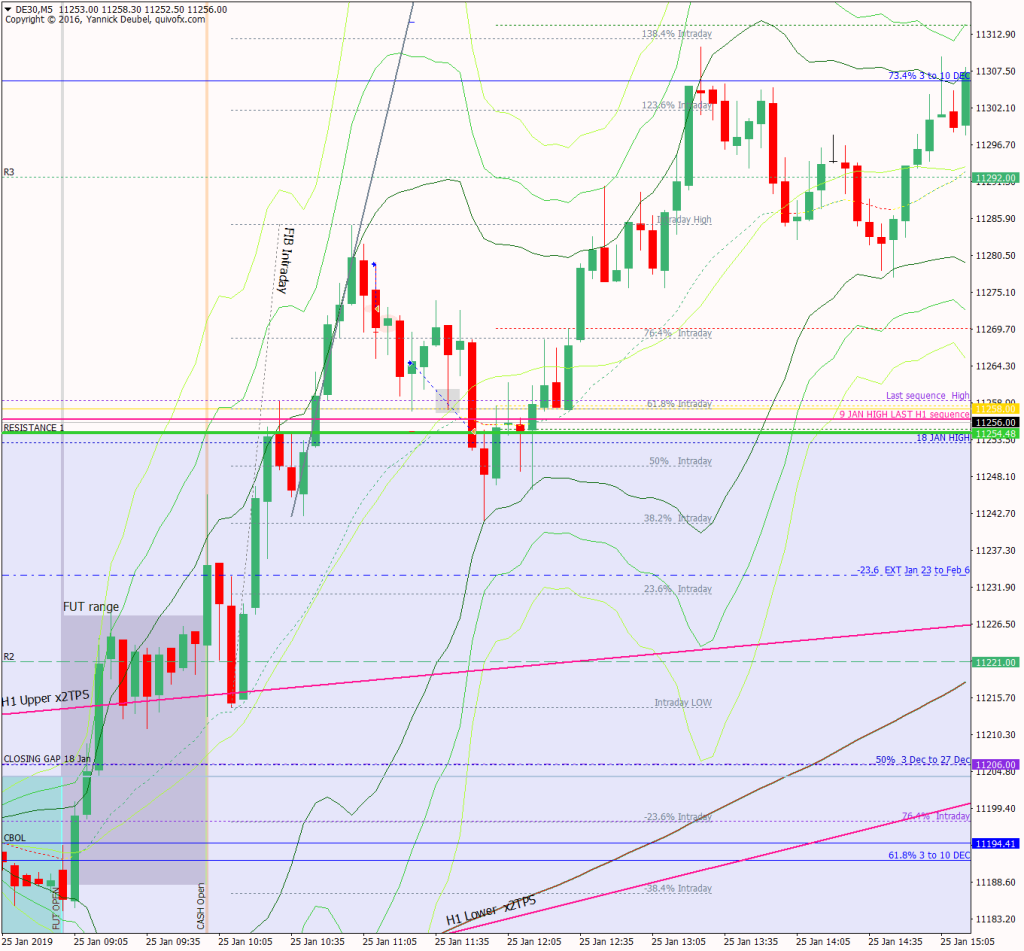
Today’s most gorgeous setup
The market opened with a 103 up gap and then came down to look for orders which it found at R2. A triangle formed above this level which made two false breaks of the upper TL. It then broke the R2 level to collect orders at the TL and then broke to the upside. This meant that the structure was a broken triangle reversal setup – and this succeeded again as a +100pt/10R trade
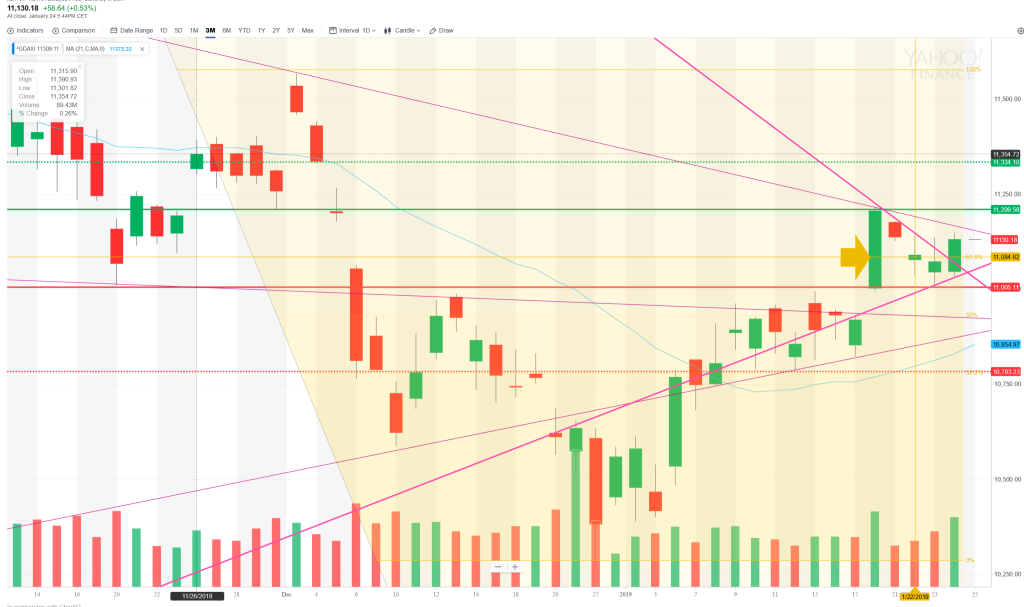
For reference: 3 month cash chart at COB yesterday


