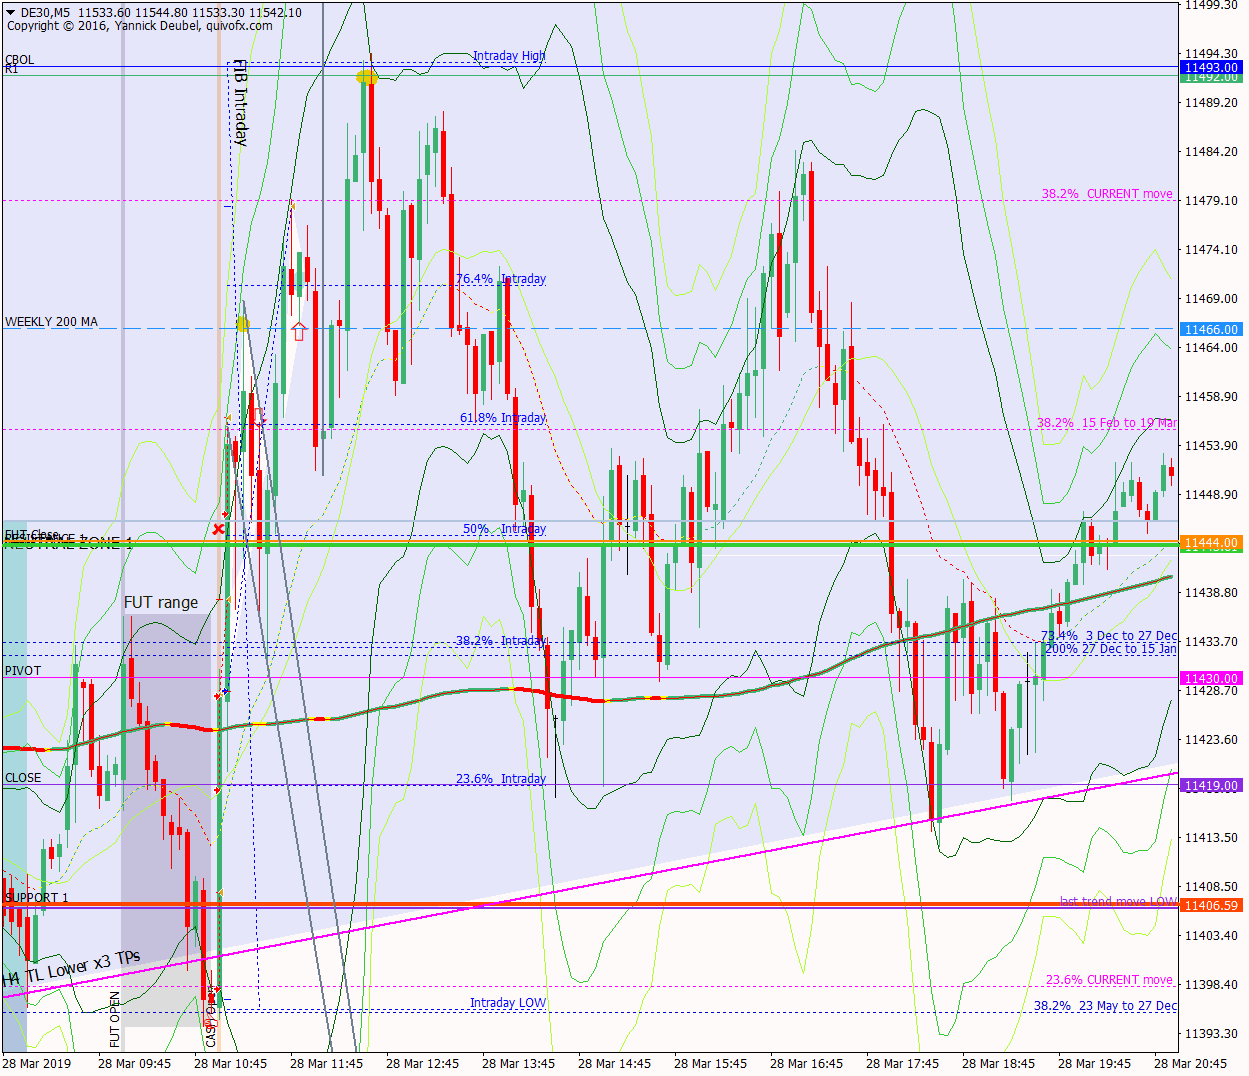
28 Mar – Hits 11500 then ranges above supporting TL
28 March 2019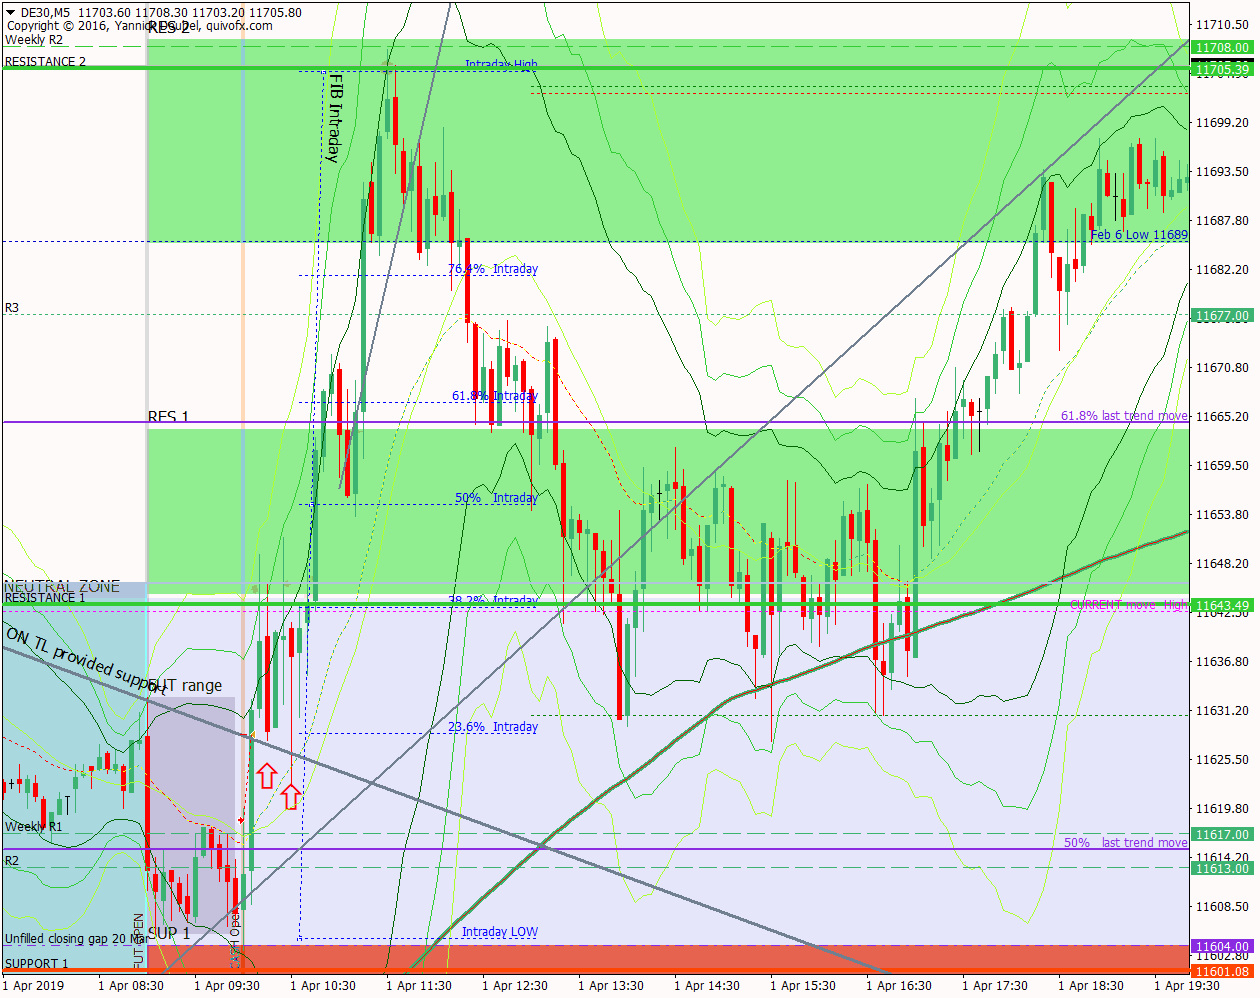
1 Apr – Dips down to the BNR then it’s off up to next one
1 April 2019Pre-open scenarios
Yesterday the market closed at the lows but this morning the futures have opened near the highs. The TL supporting the move saw two touches yesterday and in both cases, this triggered strong buying. The weekly 200 MA at 11466 was a magnet yesterday, and the market had enough momentum to get beyond it to make a high at 11494, just below the BNR. Today the BNR will be an interesting area and if it fails there, we could see the supporting TL broken as this is now above the weekly 200 MA. Beyond 11500, there are plenty of levels to target – weekly S1 at 11524 and daily 21 MA at 11542. If it breaks 11500, I can watch the response to these levels to see if it is an impulsive or stair step trending move – if it’s the latter there will be plenty of reversals and retests and if it’s the former it will just blast through all levels.


Futures opened at 11483, leaving a gap of +55pts against the cash close and 18 against the futures close. The futures open was within yesterday’s range so there are no ex-gaps.
Physical/body
Sleep – what time did I go to bed? 23:45 so 7hrs sleep
How much coffee have I had? one medium pot
How do I feel? Tired and nervous that I will repeat yesterday’s debacle
H4 and H1 charts from the morning futures session


Scenario 1: hits 11500 early in the session and then reverses to break the TL below. Spot on for 9:00 to 11:00
Scenario 2: bursts through 11500, sees minor retraces at each level and sets the stage for a steady move upwards towards daily 200MA at 11731 next week. Approximate for afternoon sessionScenario 3: reverses at or after 11500, but then finds suppport at the weekly 200 MA
What the market looked like at the end of the session

PA during my trading hours

Key points about today's PA and setups that worked
The weekly 200MA provided support for the first hour and then the market made a false break below this level to the next fib. It didn’t do much with the bounces until it made a false break below the supporting H4 TL during the afternoon session, which got all the sellers out of the way and allowed the market to break through 11500 to reach the cash daily 21MA
- the 11500 level was restested in the first few minutes and from there the market made a swift reversal down to the weekly 200MA
- it bounced twice from that level setting up a 3Min Bolli each time
- from there it was unable to get beyond the 169 and the second bounce found more sellers between the KL and the 169
- the third test of the level failed and price made a trip down a fib from where is made a fairly feeble reversal
How effective was my Neutral Zone? The lower bound was spot-on and provided two nice Bolli Band setups and one triangle to break back in; the upper bound was not in play.
How precise were my levels? SUP was missed the first time the market got near it and exceeded on the downside on the second attempt – which created a perfect bull bar entry signal. RES 1 was active at the futures session and in the first few minutes – plus on afternoon session retest – however, once all the orders had been hoovered up, it was ignored and the market punched straight through it
What I did

TOTAL = -11R | # Trades 27 | Winners 2 | BE 6
Average R per winner = 1 | Losses > 1R = 0 | Scratched (loss<1R) = 8 (-1.2R)
R-multiples: trades 2:1 or more = 2 | trades 5:1or more = 0
Outcome using standard TP strategy and same trades:
(STE at 1:1 50% off at +20 and 50% off at +50)
2:1 trades (2R) + 5:1 trades (0 x 2.5R) + BE (0R) + Losses (-10R) = -8R
My result vs. SYS = -3R
On TILT trades = 10 (-5.5R)
Today's most gorgeous setup
The sell at 11500 just after theropen was just about 5:1 but I didn’t take it as it was not outside the Bolli Band, but since this level was one of my scenarios, I should have taken it anyway – so this has been added to my trade plan.
Thre were 2x 2:1 Bolli Band longs which I have shown below – and a 5:1 Bolli Band long but that was after my trading session.

For reference: 6 month cash chart at COB yesterday


