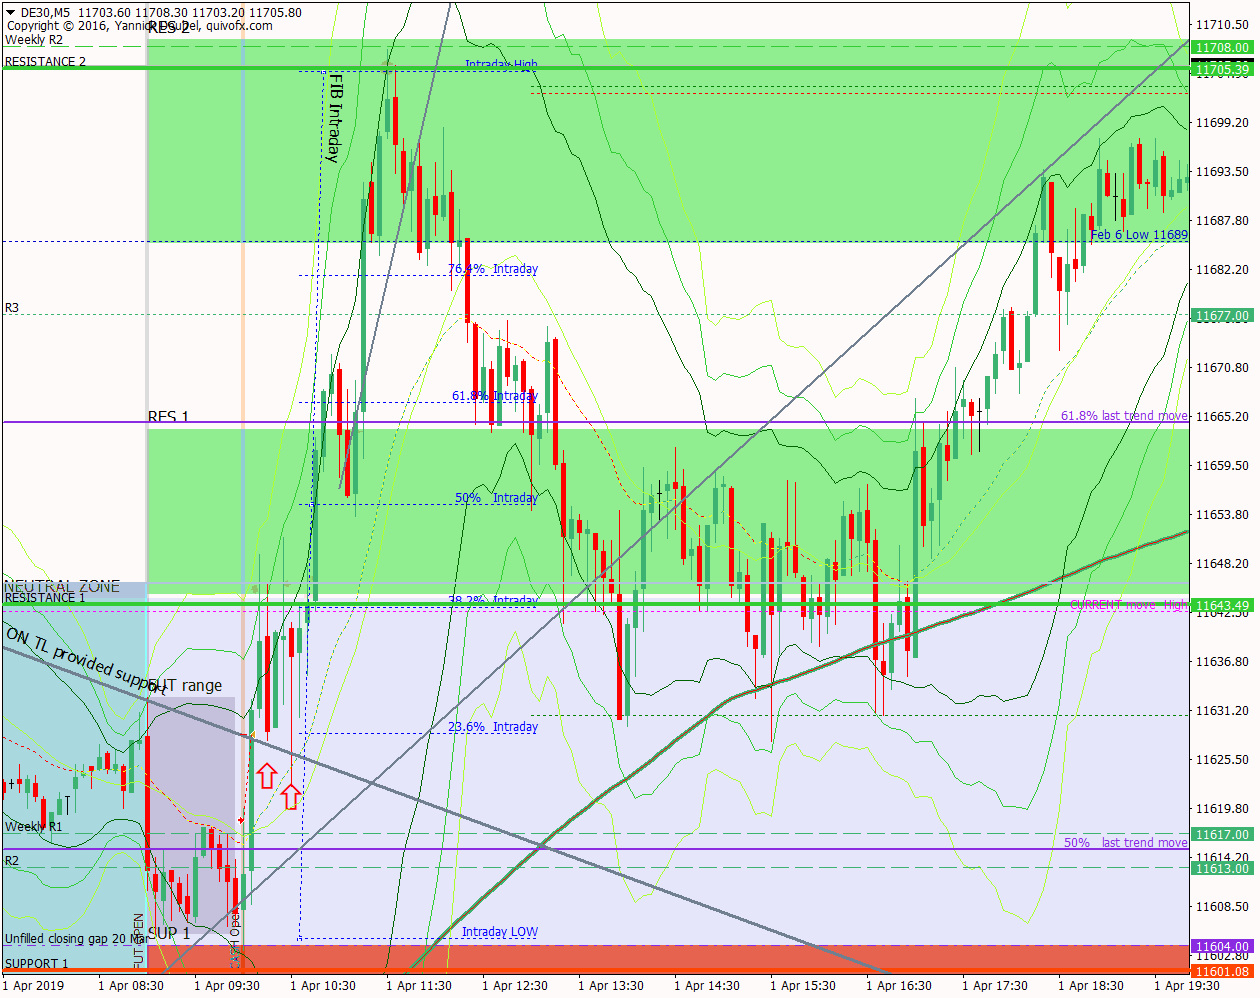
1 Apr – Dips down to the BNR then it’s off up to next one
1 April 2019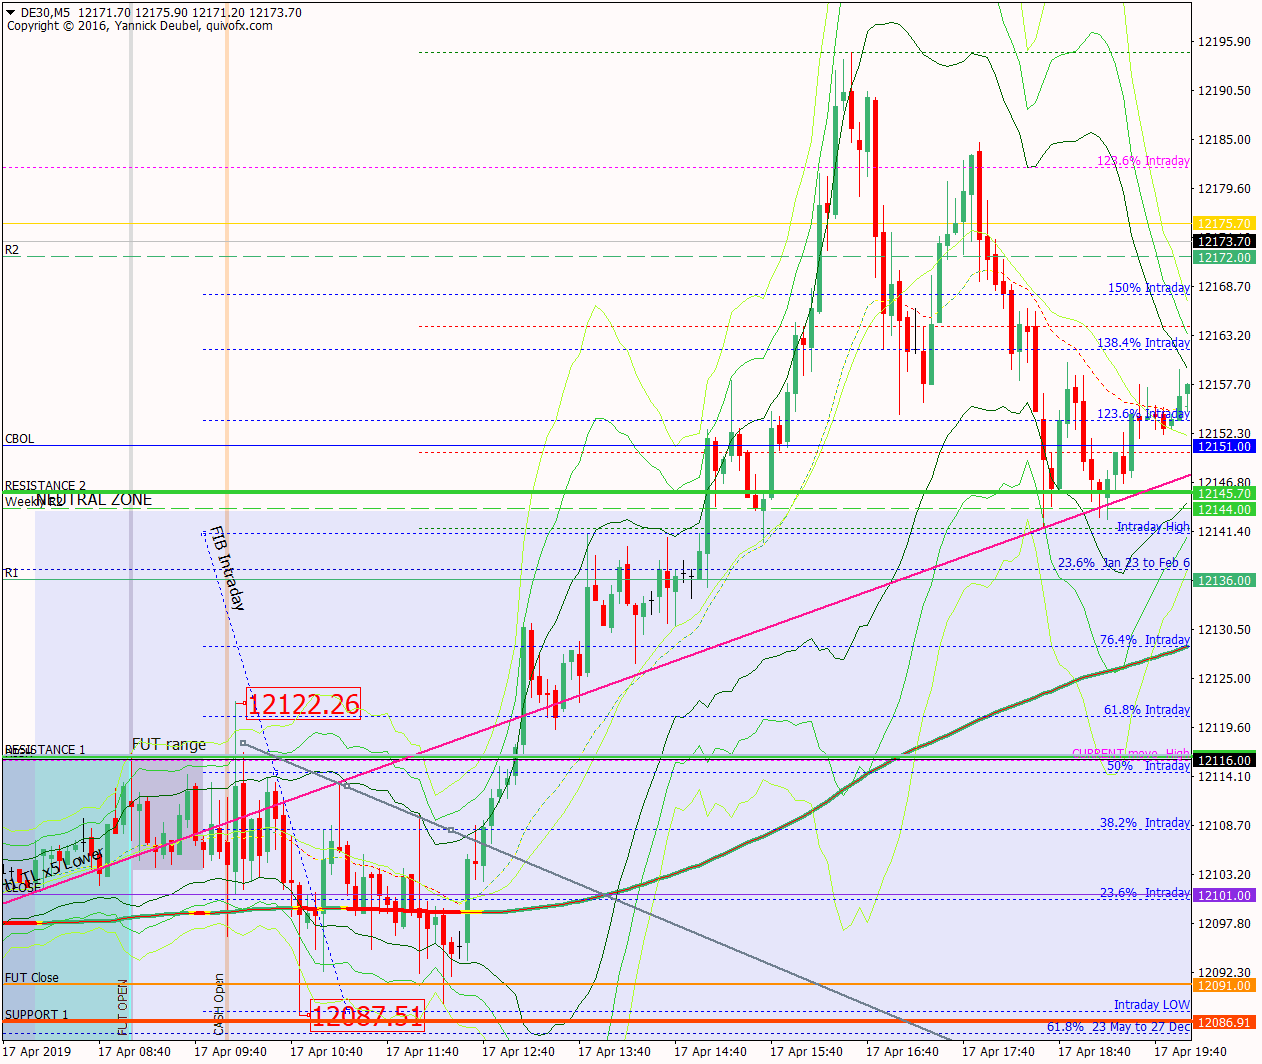
17 Apr – Tepid early session followed by a break up though resistance from last few sessions
17 April 2019Pre-open scenarios
The last few days have been hugely bullish and the market is now more than 200pts above Monday’s open. The market is forming a rising wedge on the H1 chart and is at critical levels, including weekly R3 and daily R2. So will there be a pullback today? The Dax can easily go 1000pts with barely a pause, and the the current trend started at 11300. The market has cleared a lot of critical cash levels: daily 200MA, daily 50MA, weekly 50MA and now it trading around the weekly 200MA at 11869 so that will be the level to trdae today.
I added the yearly chart to show context for the level the market is currently at.


Futures opened at 11856, leaving a gap of +101pts against the cash close and 60 against the futures close. The fututres open created an ex-gap against yesterday’s high of 78pts
Physical/body
Sleep – what time did I go to bed? 23:15 but I got up lots of time to record the retreat
How much coffee have I had? Half a medium pot
How do I feel? Not really prepared but I will be interested to see how I can release today
H4 and H1 charts from the morning futures session


Time stamp: 8:30Scenario 1: selling at the weekly 200MA down to the ex-agp at 11778 and then the gap at 11755
Scenario 2: small retrace to close the ex-gap at 11778 and then a break of 11869Scenario 3: hits 11869 and then sees a bigger, trending decline to the 74.6% at 11720 and beyond
What the market looked like at the end of the session

PA during my trading hours

Key points about today's PA and setups that worked
One sentensethe market was a in strong uptrend yesterday and ON and that continused throughout the session.
-
at the open the market dipped down to R2 which was the LOD
- the buying from R2 hit some resistance at the TL/200 Weekly MA and Weekly R3 but the pullback from these levels was shallow – only to around the intraday 505 area
- clearing the resistance took three attempts and on the second attenpt the market made a significant new high followed by a shallow pullback to the KL
- once it had cleared that resistance it went stright for R3 which capped prices during cash hours
- the H1 TL turned out to be the most significant level today and acted as support during the entire session.
How effective was my Neutral Zone? This was in the correct area but the weekly 200MA or TL would have been a better location
How precise were my levels? RES 1 overshot by enough to turn a BE into a loser – the level should have been between Weekly R3 and Weekly 200MA, as putting it in front these level was asking for trouble; RES 2 was spot on. SUP levels were not in play
What I did

TOTAL =-6R | # Trades 23 | Winners 4 | BE 3
Average R per winner = 2.2 | Losses > 1R = 0 | Scratched (loss<1R) = 3
R-multiples: trades 2:1 or more = 4 | of those, trades 5:1or more = 2
Outcome using standard TP strategy and same trades
2:1 trades (4R) + 5:1 trades 2 x 2.5R) + BE (0R) + Losses (-13R) = -4R
My results vs. SYS = -2R
ON TILT trade = 9 (-8.25R)
Today's most gorgeous setup
Th Jigsaw spike into R2 would have been a lovely trade – if I had allowed it to run. The H-C-Bs around RES1 were tricky trade with plenty of false breaks, so the prize today goes to the retest of RES 1 after the confluence of levels was broken and the H1 Tl exceeded. This trade gave a nice easy entry and 3mins to get into it.

For reference: 6 month cash chart at COB yesterday


