3 Dec – Huge move up and then… nothing
3 December 20185 Dec – Rallied to close Friday’s gap and closed where it opened
5 December 2018Pre-open Scenarios
With the gaps below and the ON action signalling an open below yeserday’s low, the tone was bearish – at least in the short-term. The question was whether we would see a fast, impulsive move down or a slow, steady filling of the untraded zone between Friday’s high 11317 and Monday’s low at 11457.
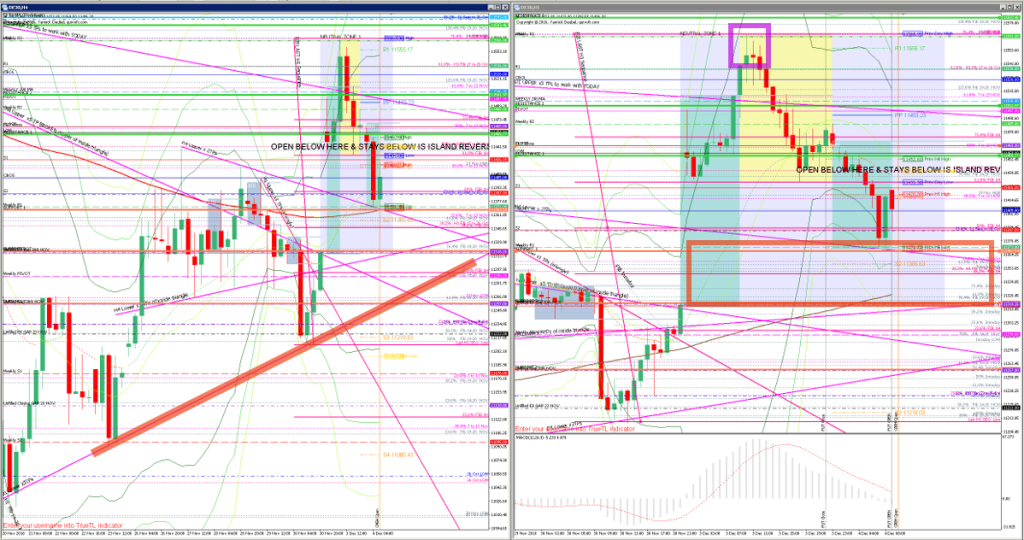
What the market looked like at the end of the day
How effective was my Neutral Zone? The Neutral Zone today covered all of yesterday’s PA plus the gap and price stayed within the zone for the entire session.
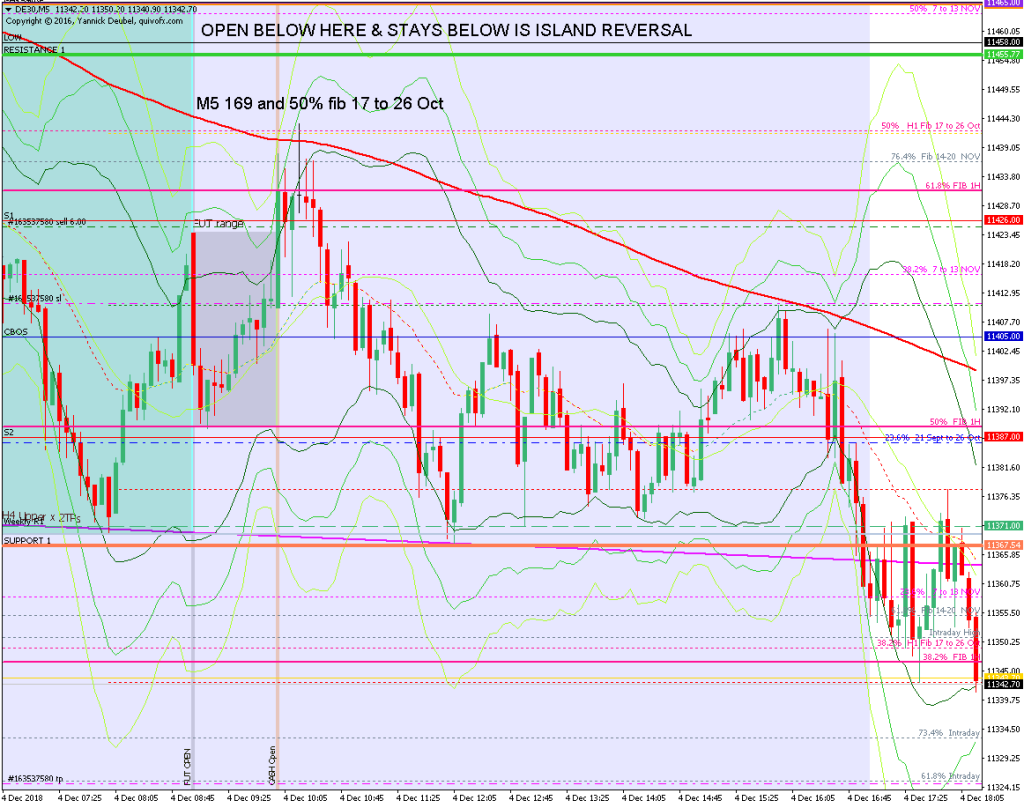
How precise were my levels? The RES levels weren’t in play and SUP 1 was spot on.
Strategy for today’s PA
Selling an opening spike worked well, as did a 3Min Bolli at the 50% fib of 17-26 Oct move. After that, strategies that I normally use for trending markets were effective. Without the unfilled ex-gap above – which made me wary of taking shorts – this was clearly trending PA on the H1 chart.
What was today’s PA? Was it ranging or was it trending? When and how did I know which one it was
What I did
09:00 Buy x 21 @ 11429 | H1 TL break | P&L = -1R
09:00 Sell x 86 @ 11430 | Cash open spike | P&L = 0.7R
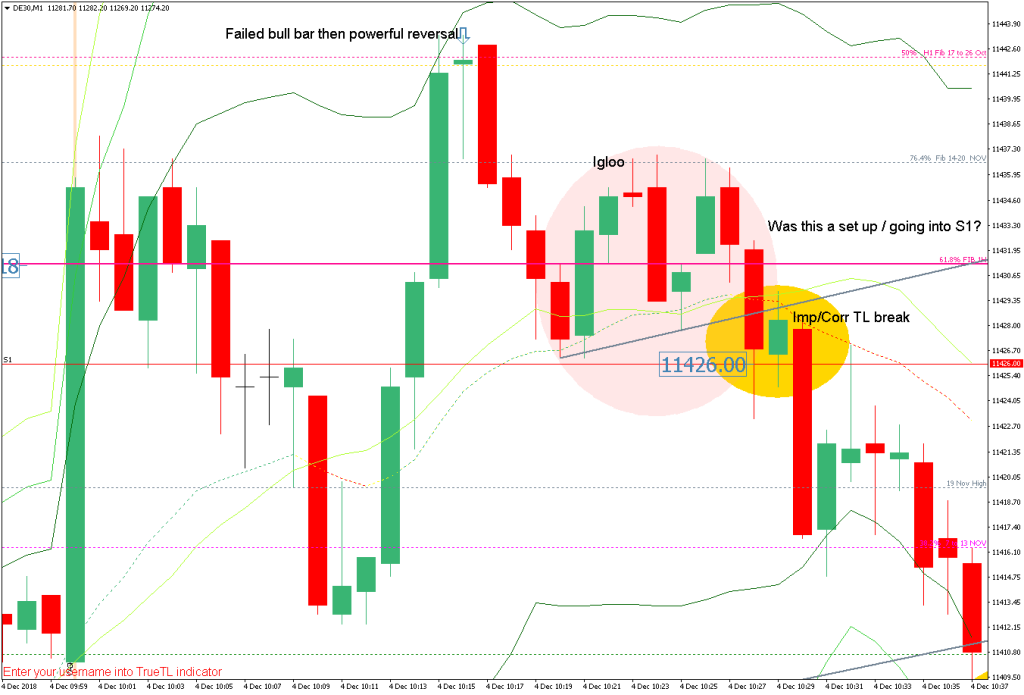
09:29 Sell x 47 @ 11424 | Igloo | P&L = +1.8R
09:47 Buy x 48 @ 11420 | NONE reaction to missed buy | P&L = -0.5R
09:58 Buy x 79 @ 11408 | 3Min Bolli | P&L = -1R
10:07 Sell x 86 @ 11398 | M1 TL break by hand, TL, BNR | P&L = +1.3R
TOTAL = +1.4R
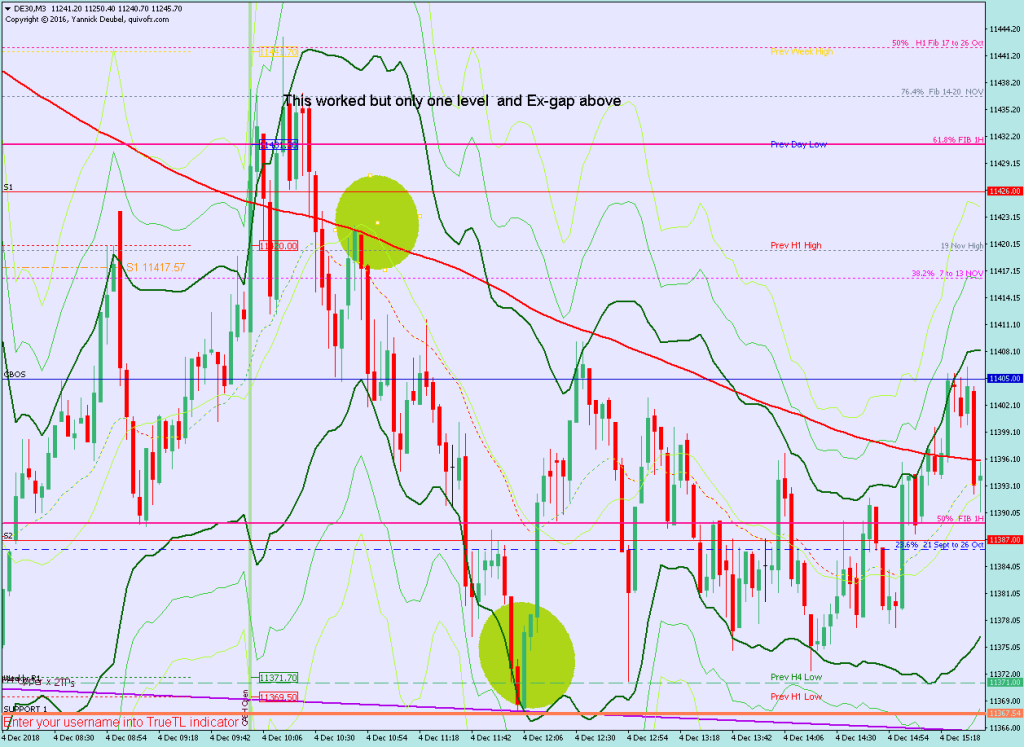
Today’s most gorgeous setup
Chart plus short explanation
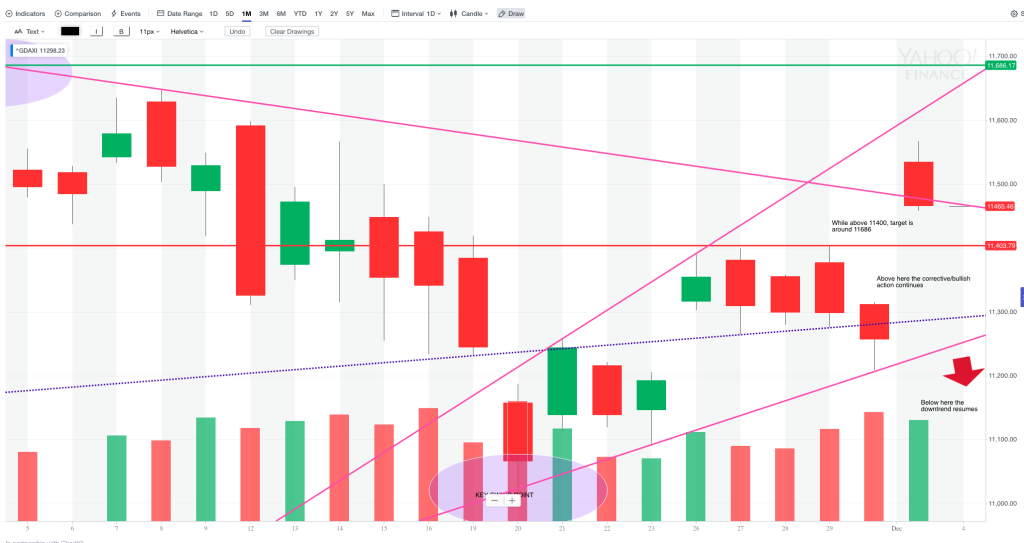
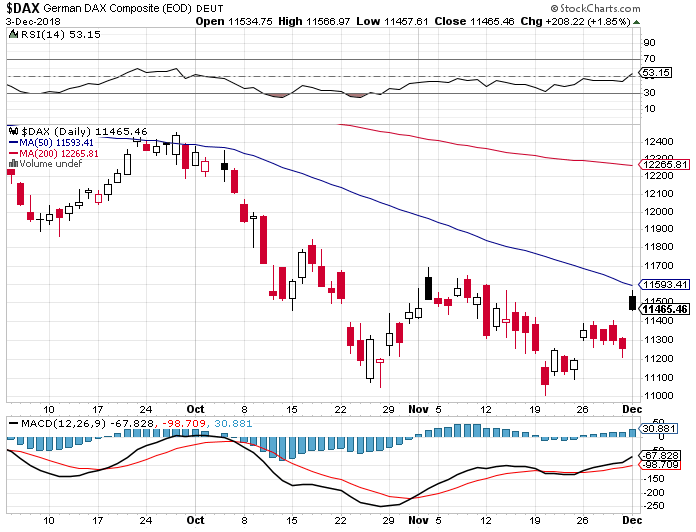
For reference: 3 month cash chart at COB yesterday


