5 Dec – Rallied to close Friday’s gap and closed where it opened
5 December 2018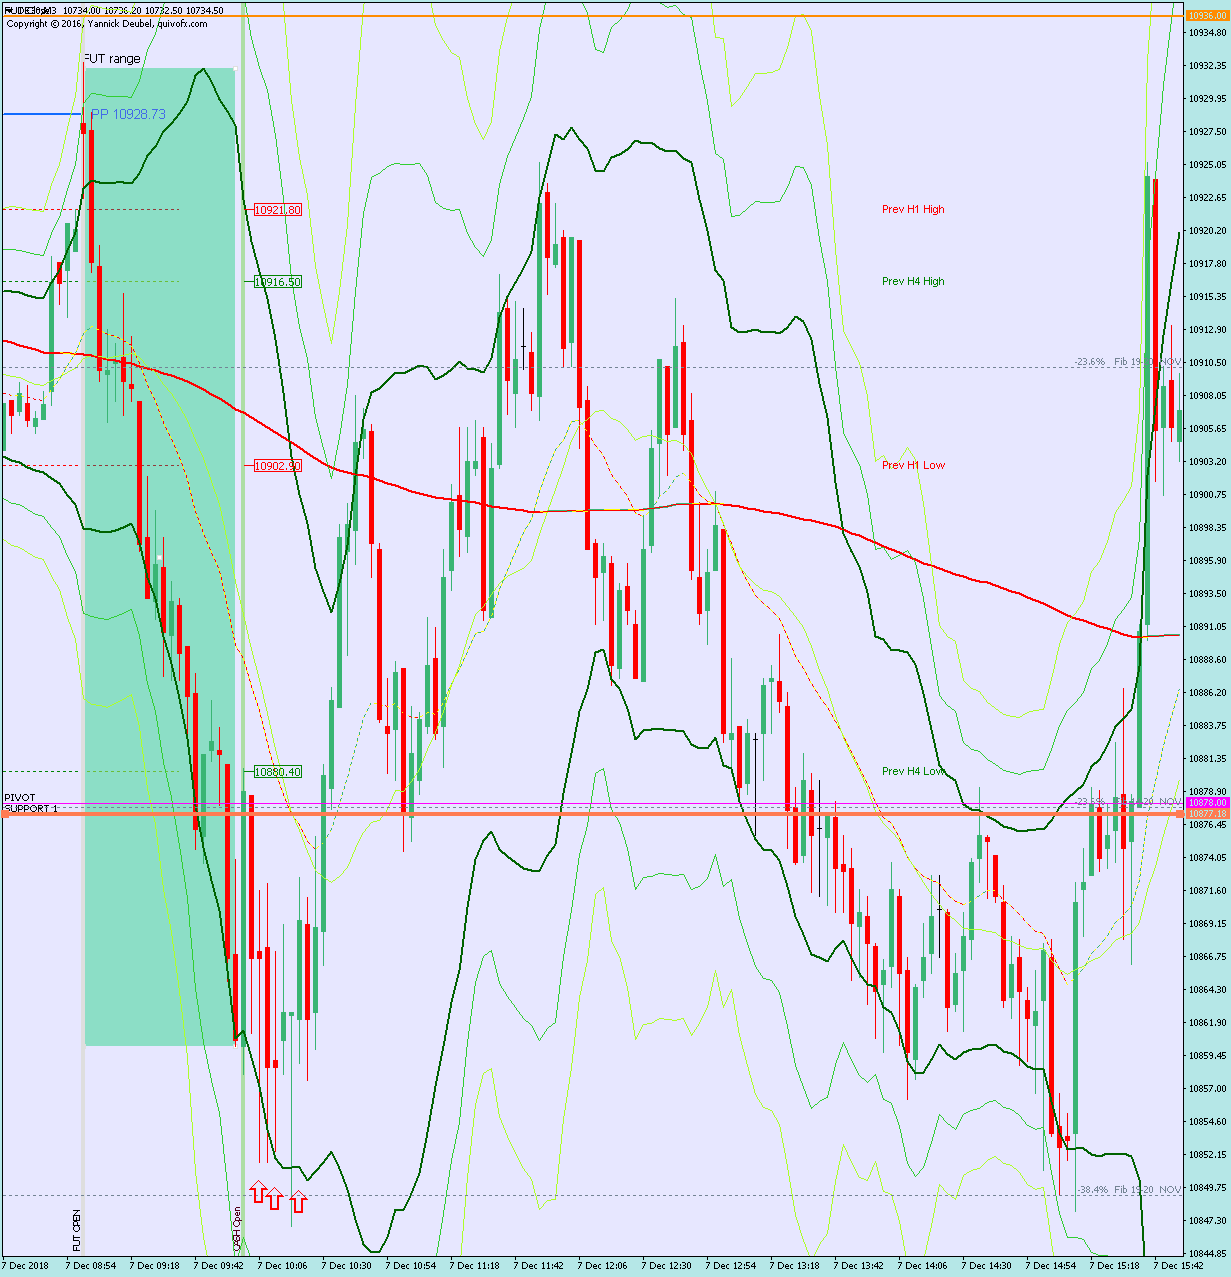
7 Dec – Breif respite towards futures gap and then more selling
7 December 2018Pre-open Scenarios
Again, we saw a big move down ON, so again, we were presented with the same question: would the selling continue or would we see a gigantic bear squeeze – probably with some lower prices first just to entice more shorts into the market.
if this breaks then we have a new low for the year.
What the market looked like at the end of the day
Carnage. And all the papers and news sites are full of headlines about ‘billions wiped off stock markets’ so tomorrow could be a long.
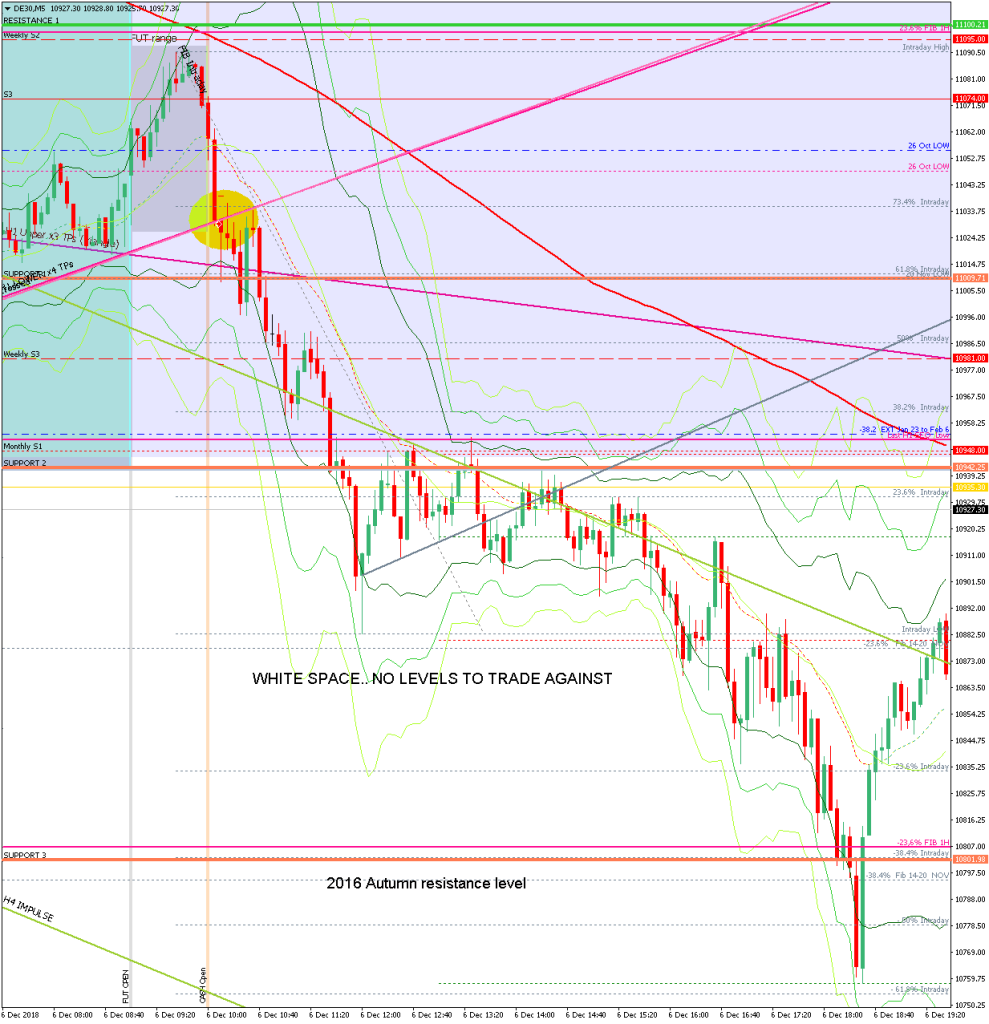
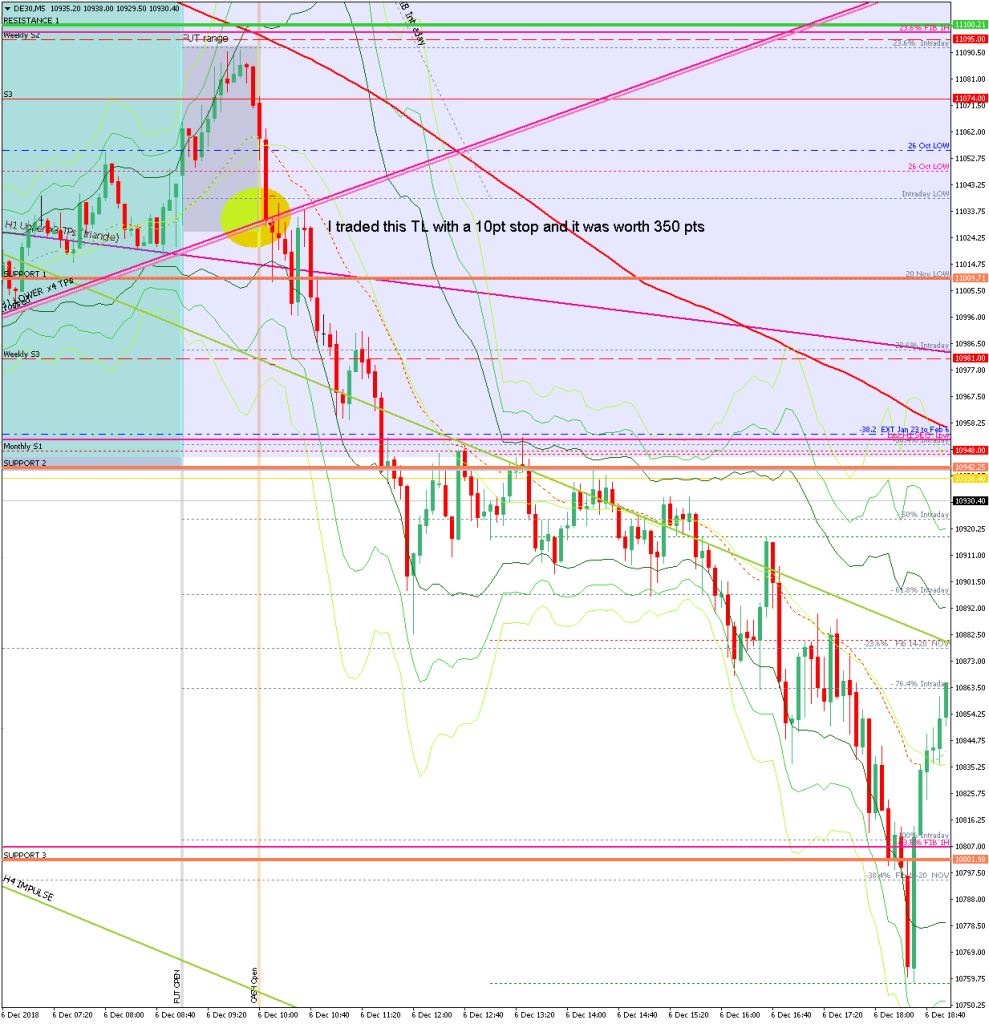
How effective was my Neutral Zone? I made profitable trades on both sides within the zone and once it broke and then compressed up against the level, the market dropped 200 pts.
How precise were my levels? RES 1 -9pts provided resistance during the futures session. SUP 1 hit and then bounced to retest the TL; the market went straight through SUP 2 but then compressed against it and SUP 3 was 8pts away from the close level but the market also powered straight through it during the session.
Strategy for today’s PA
What was today’s PA? Was it ranging or was it trending? When and how did I know which one it wasWhat I did0
9:03 Buy x 88 @ 11058 | Cash open Spike | P&L = -1R
09:09 Buy x 80 @ 11044 | 3Min Bolli | P&L = -1R
09:10 Sell x 90 @ 11029 | M1 TL Break | P&L = 0R
09:13 Buy x 81 @ 11013 | 3Min Bolli | P&L = +0.3R
09:24 Sell x 87 @ 11019 | M1 TL Break by hand| P&L = +0.8R
09:38 Sell x 96 @ 11028 | 169 fade | P&L = +1.7R
09:48 Sell x 49 @ ??? | Igloo | P&L = 1.9R
TOTAL = 3.1R
Today’s most gorgeous setup
The short of the TL that supported the ON corrective move – this captured the vast majority of the day’s action with a 10pt SL.
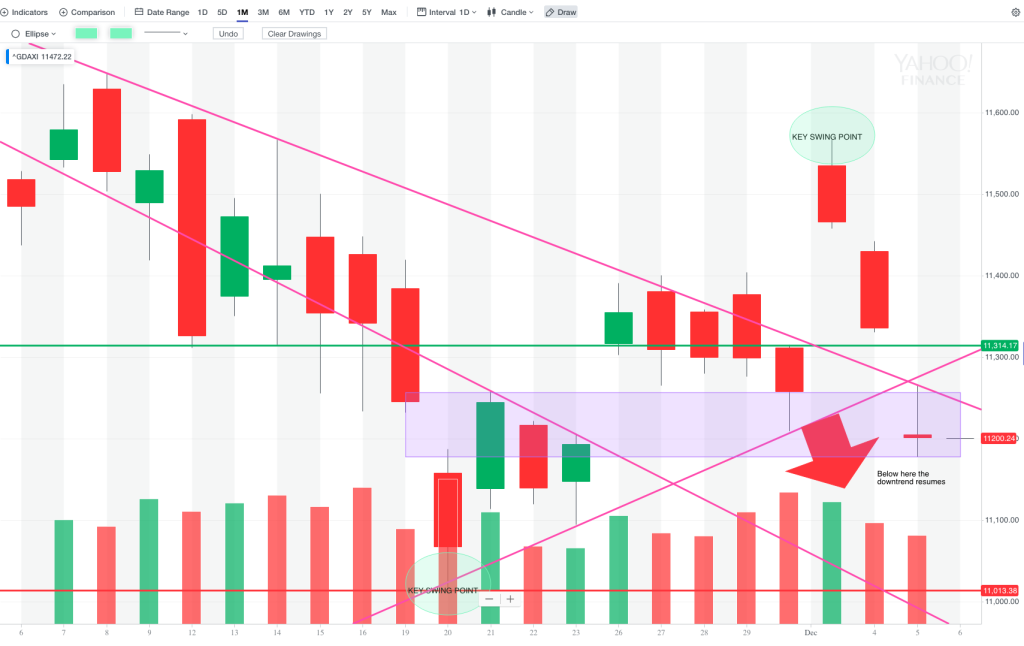
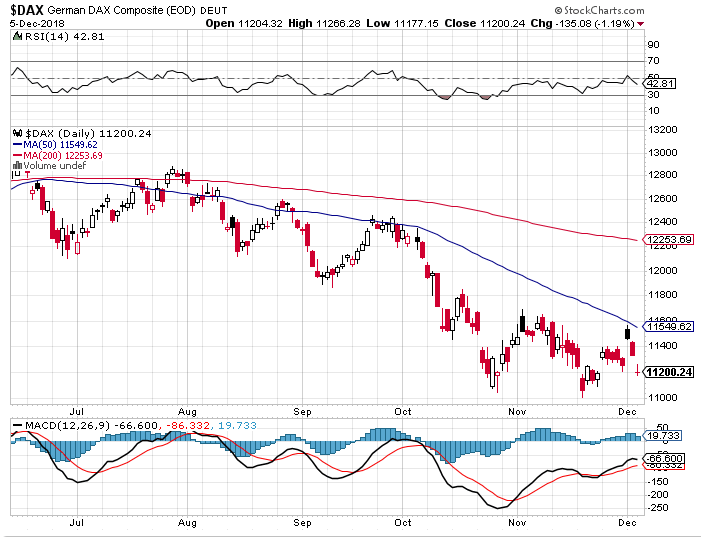
For reference: 3 month cash chart at COB yesterday


