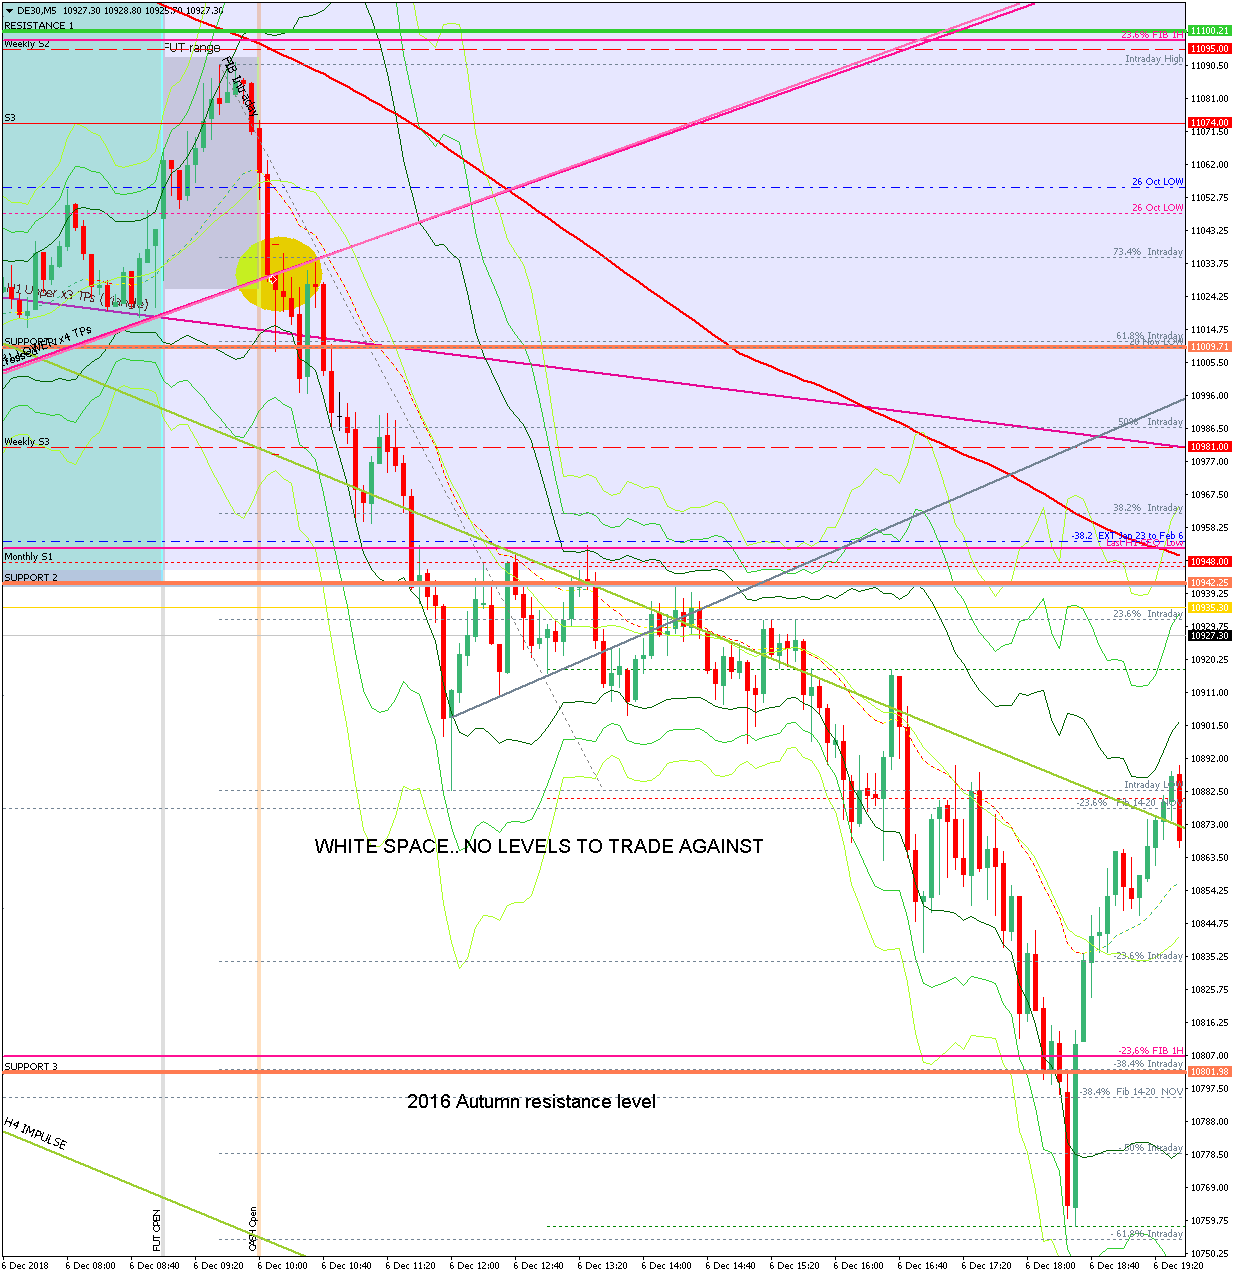
6 Dec – Bears are out but levels react … then collapse in the US session
6 December 2018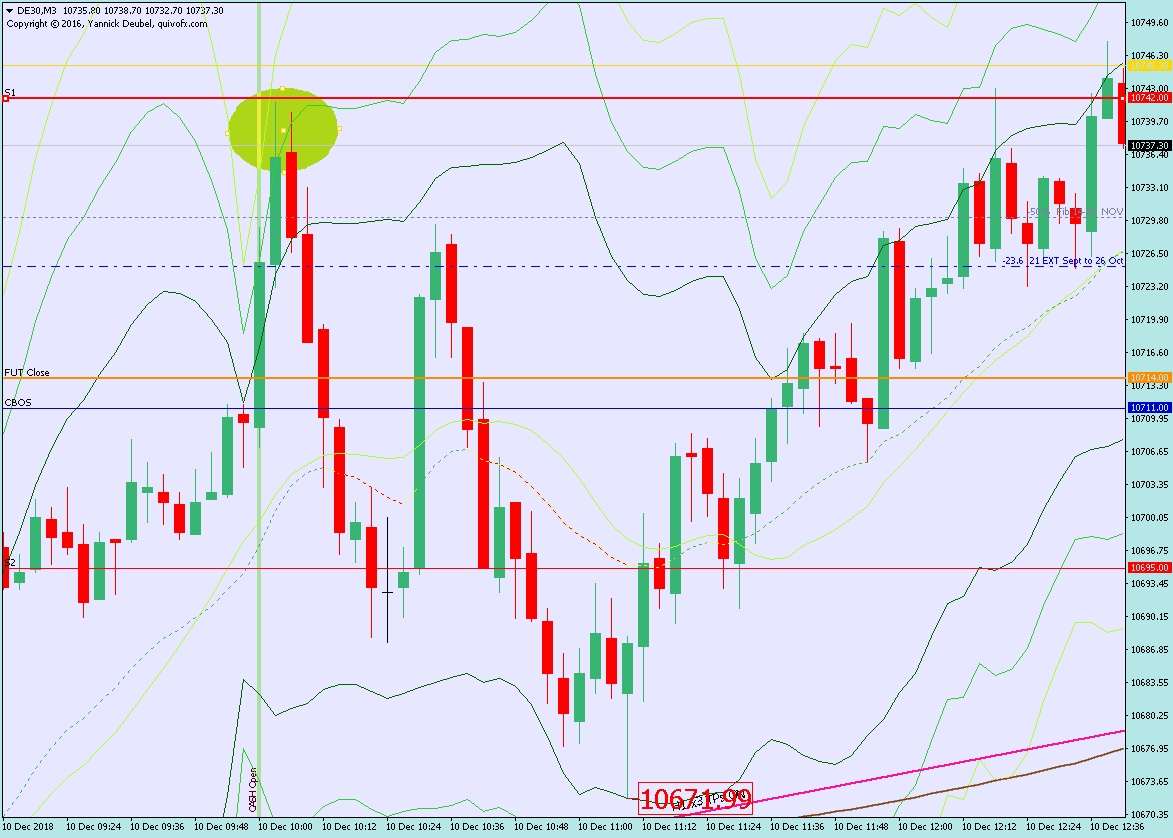
10 Dec – Ranging action up to RES 1 then reversal (again)
10 December 2018Pre-open Scenarios
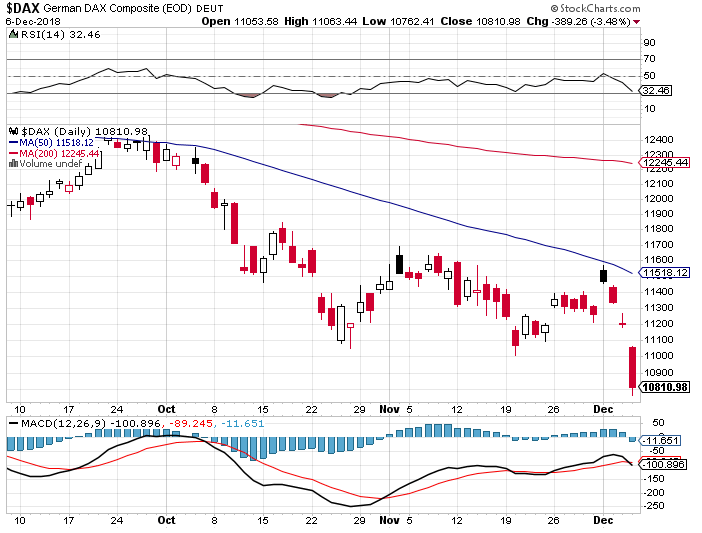
Yesterday’s bar was monstrous and red. It went way beyond making a new low. With levels breaking and staying broken we are clearly in an accelerating downtrend, but where will it stop? When will the bear squeeze come and how will I get on board? And if that is not yet where we’re at, where are the safe levels to short, where there’s reasonable stop that makes PA sense?
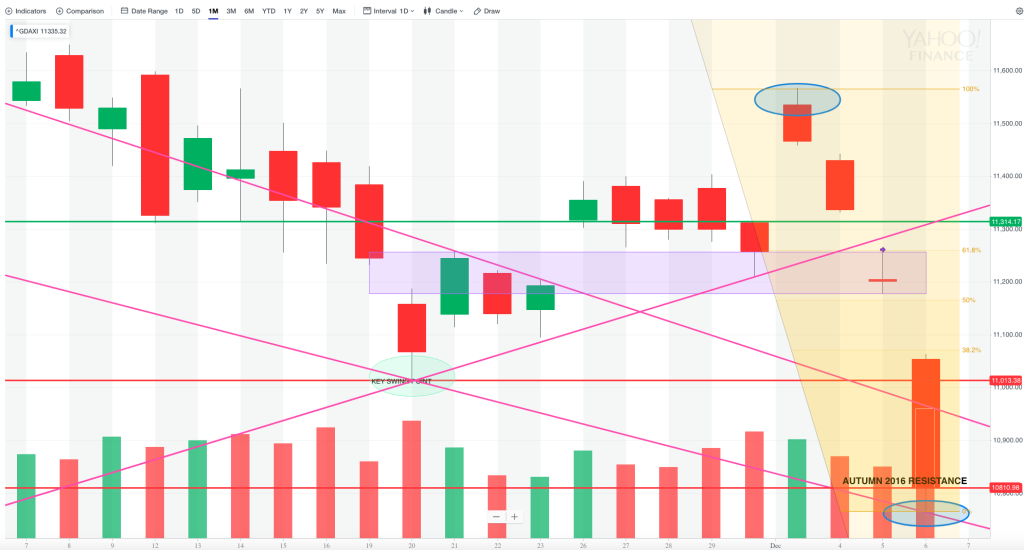
The one month chart shows how the moves of the past few days have left many gaps on the chart.
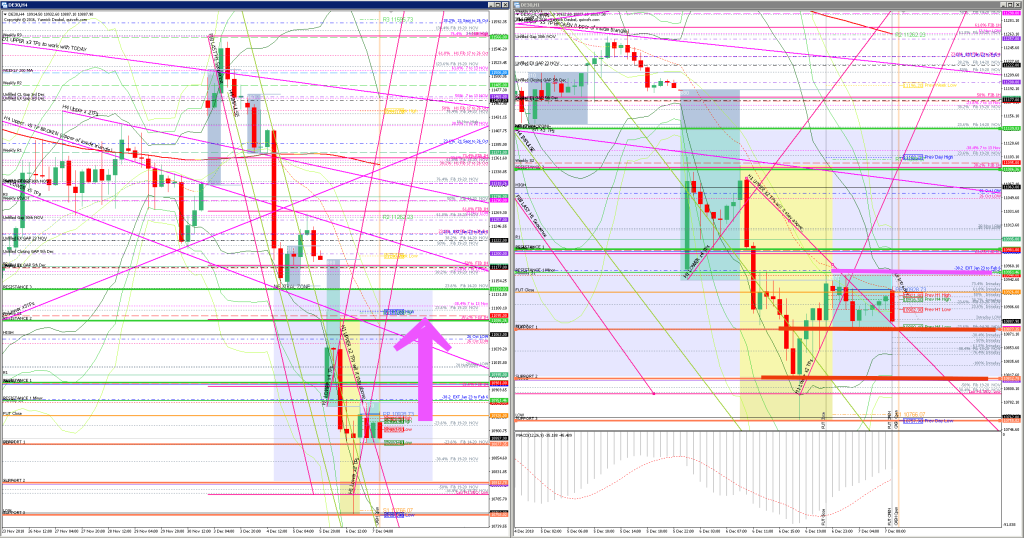
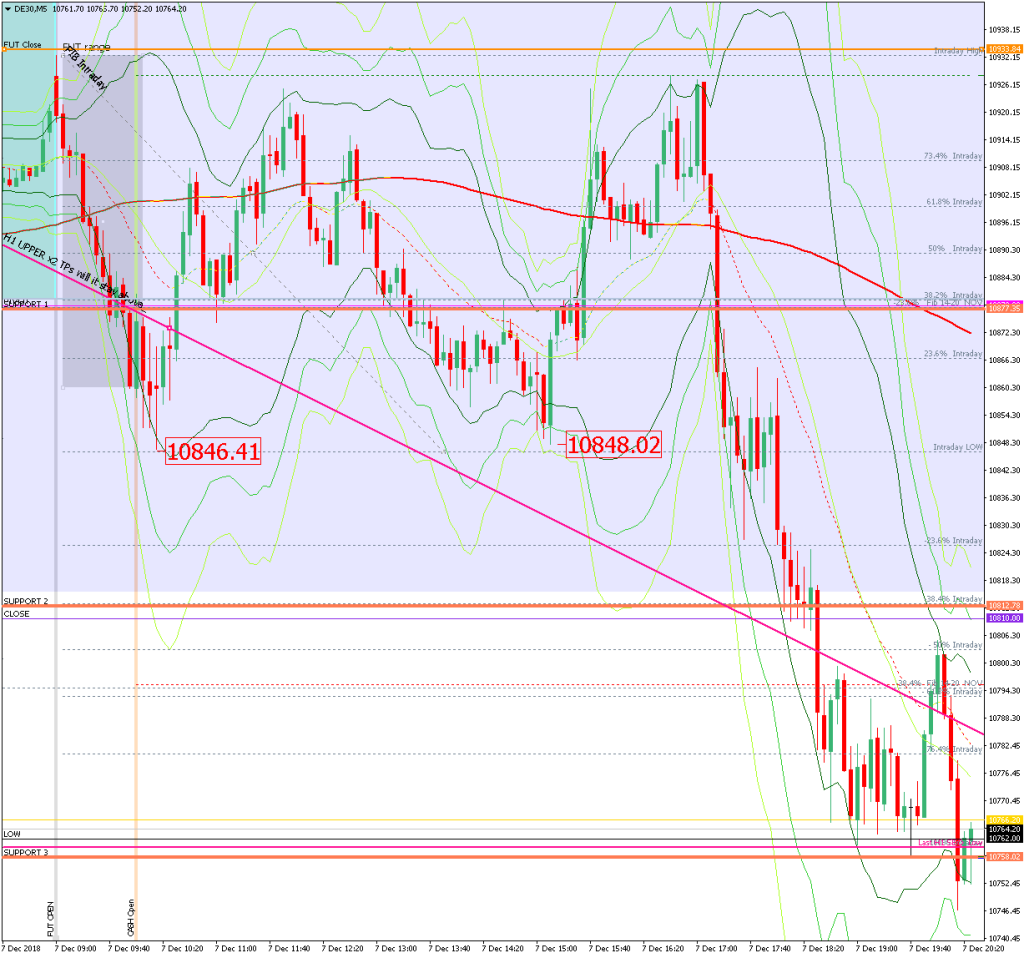
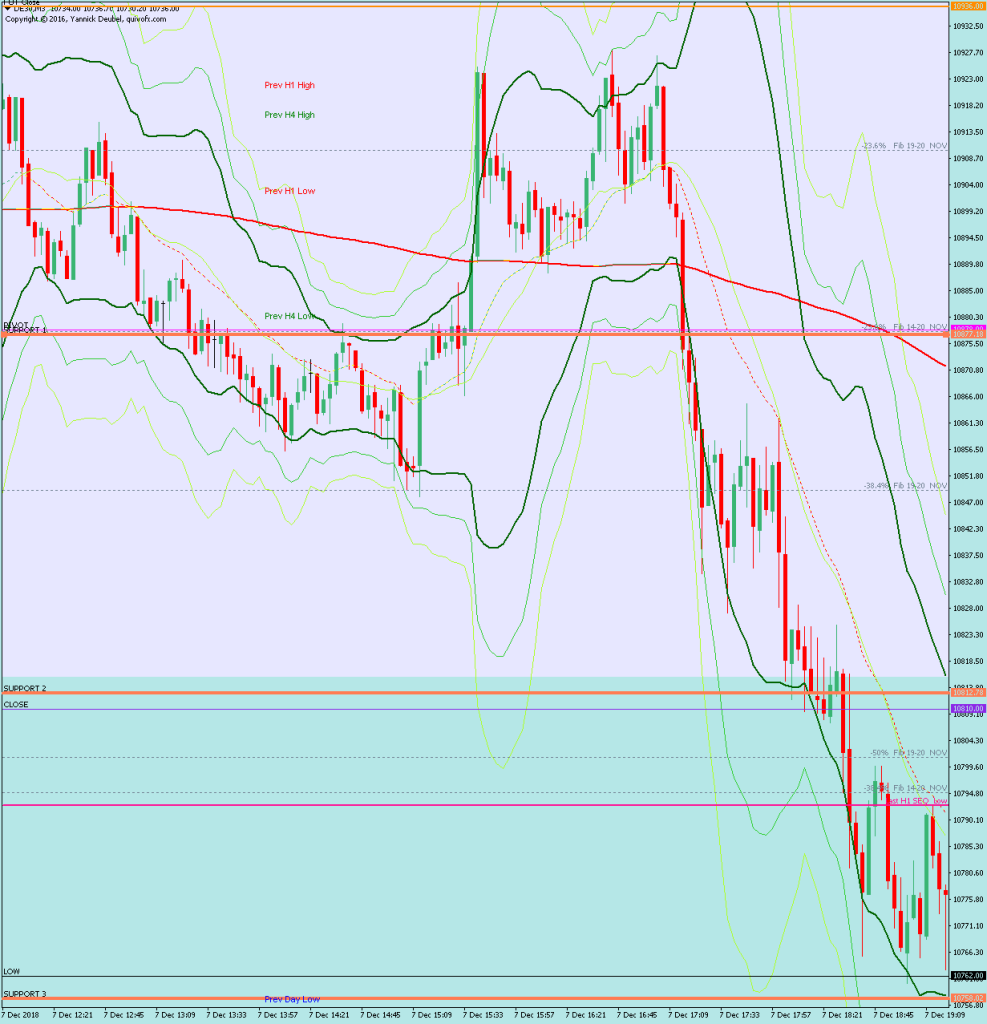
What the market looked like at the end of the day
Key points about today’s charts:
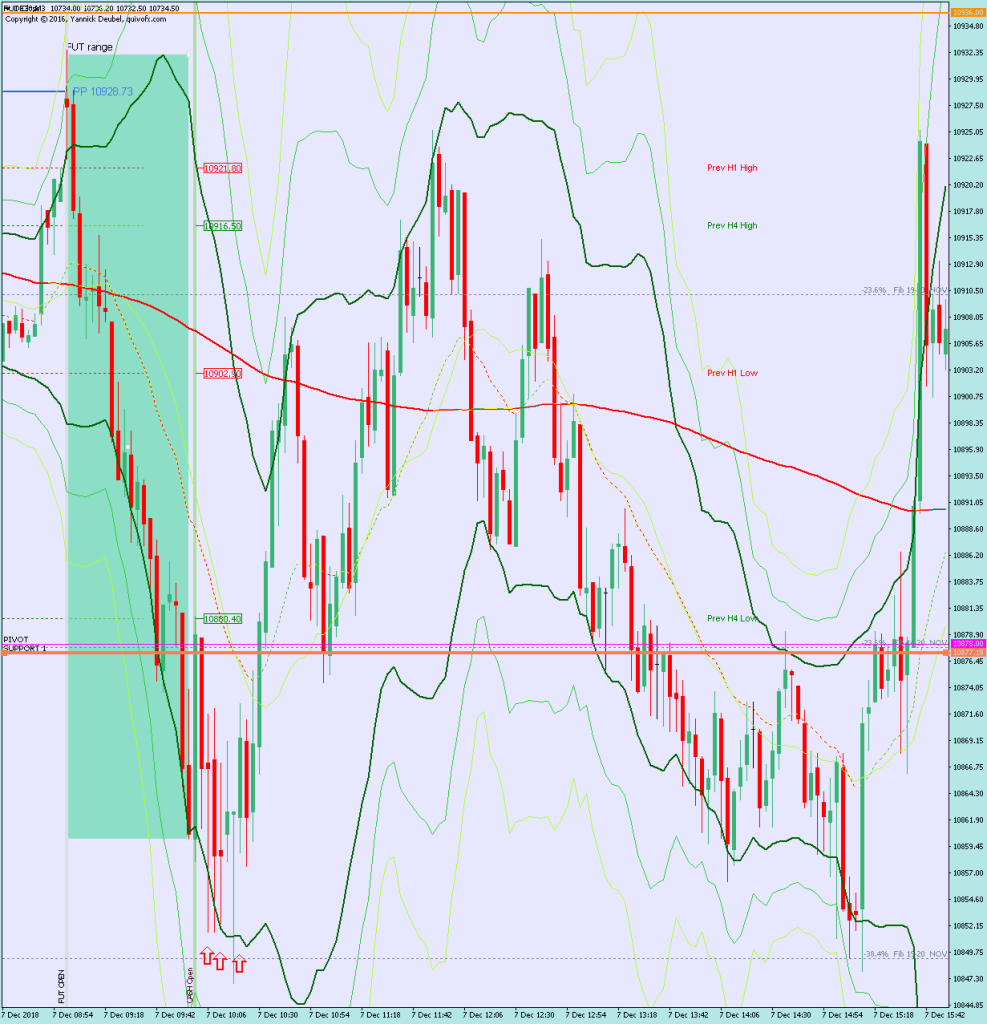
- With such a skittish market, it was hard to trade the first hour today.
- With hindsight, you can see that buying and selling extremes using the 3Min Bolli would have worked well, but without levels to trade against there is no setup for me.
- The futures gap didn’t quite fill and these levels normally get hit on the nose – was there anything special about 10928 to 10930 that got in the way or is this just one of the days when the trade didn’t set up
- The SUP 1 level is clearly active and eventually, the market goes straight through and hits yesterday’s low, selling off from the third hit of 10930.
How effective was my Neutral Zone? Longs and Short both worked while inside the zone and the lower edge of the zone was clearly an active level – indicated by the compression around it and then the speed of selling after the break.
How precise were my levels? SUP 1 was active and was tradeable and the same is true of SUP 2 which saw a compression and then a breaks. The issue today was more that I was missing levels and couldn’t find good reasons for the reversal locations.
What I did
09:02 Buy x 91 @ 10877 | M1 TL Break by hand | P&L = -1R
09:06 Sell x 24 @ 10861 | NONE | P&L = -0.6R
09:15 Buy x 49 @ 10863| 3P HLR | P&L = -0.6R
09:21 Buy x 89 @ 10862 | M1 TL Break by hand | P&L = +2R
09:33 Buy x 90 @ 10881 | M1 TL Break by hand| P&L = +0.8R
09:39 Sell x 100 @ 10892 | M1 169 Reversal| P&L = -1R
09:43 Sell x 100 @ 10900| M3 169 Reversal | P&L = 1R
10:01 Sell x 91 @ 10876 | M1 TL Break by hand | P&L = -1R****
TOTAL = -0.34R
*** This trade was officially against the rules as I took it after 10:00. My 10:00 to 11:00 trading is breakeven but at the moment, I am focusing the first hour only.
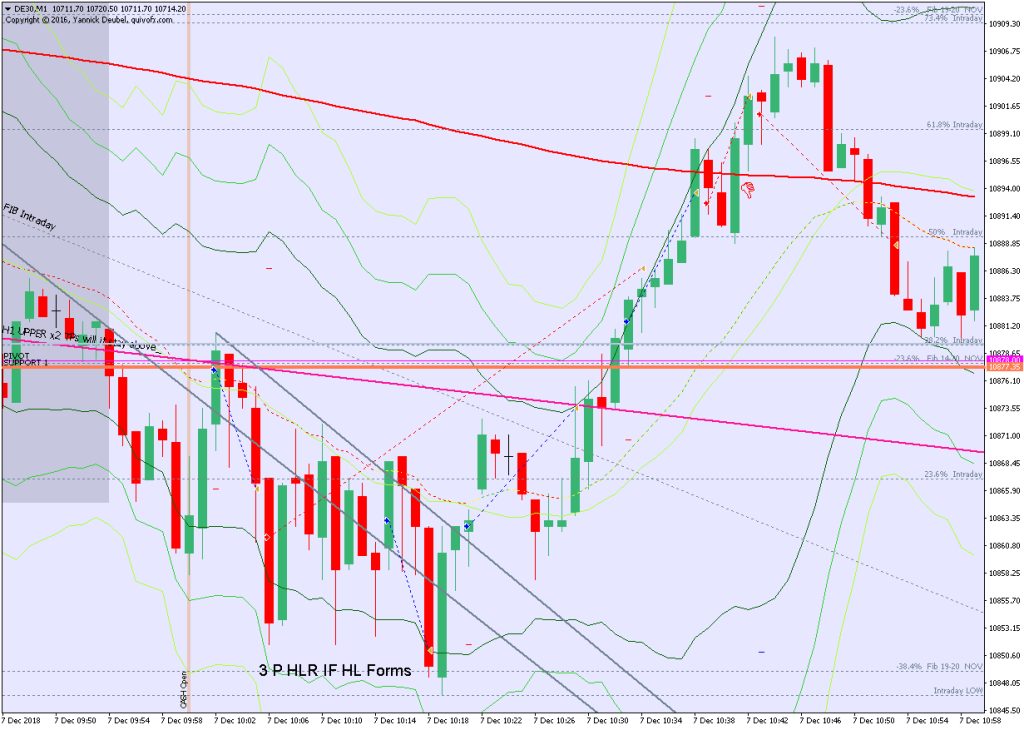
Today’s most gorgeous setup
This was the 3P HLR just after the open. The market opened with sell orders and then we started to see long wicks and buyers finally able to make some headway.
For reference: 3 month cash chart at COB yesterday


