View Categories

Using the daily cash chart to trade on the M1

< 1 min read

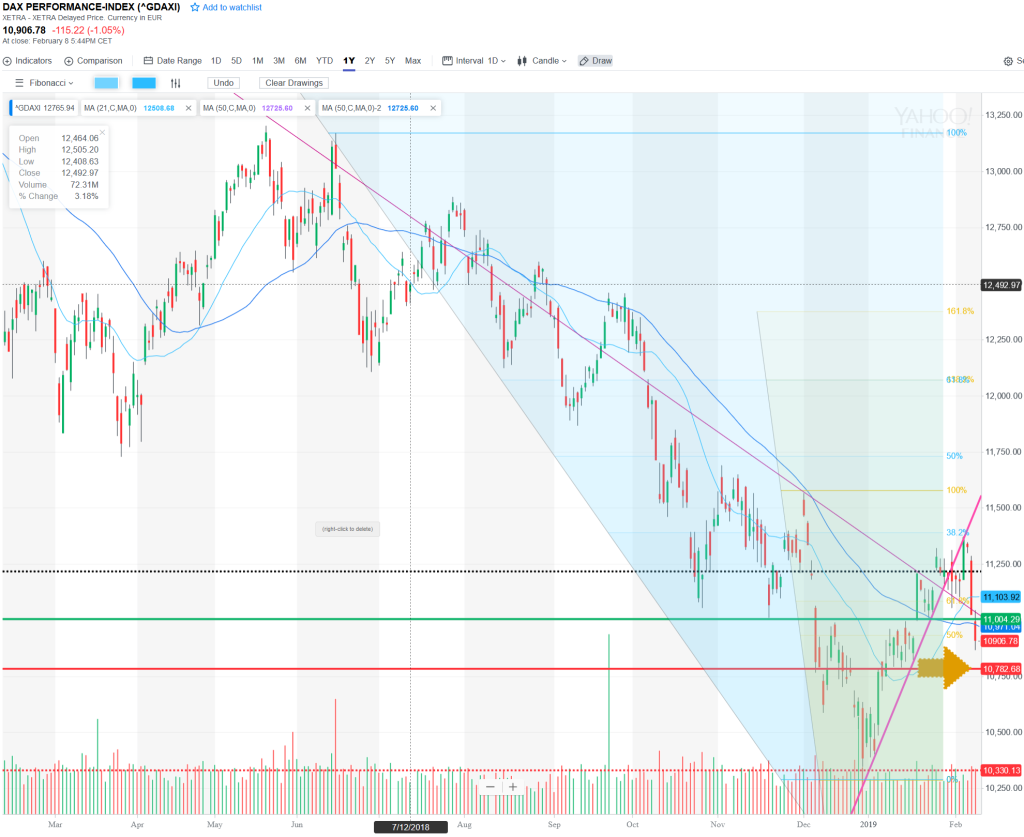
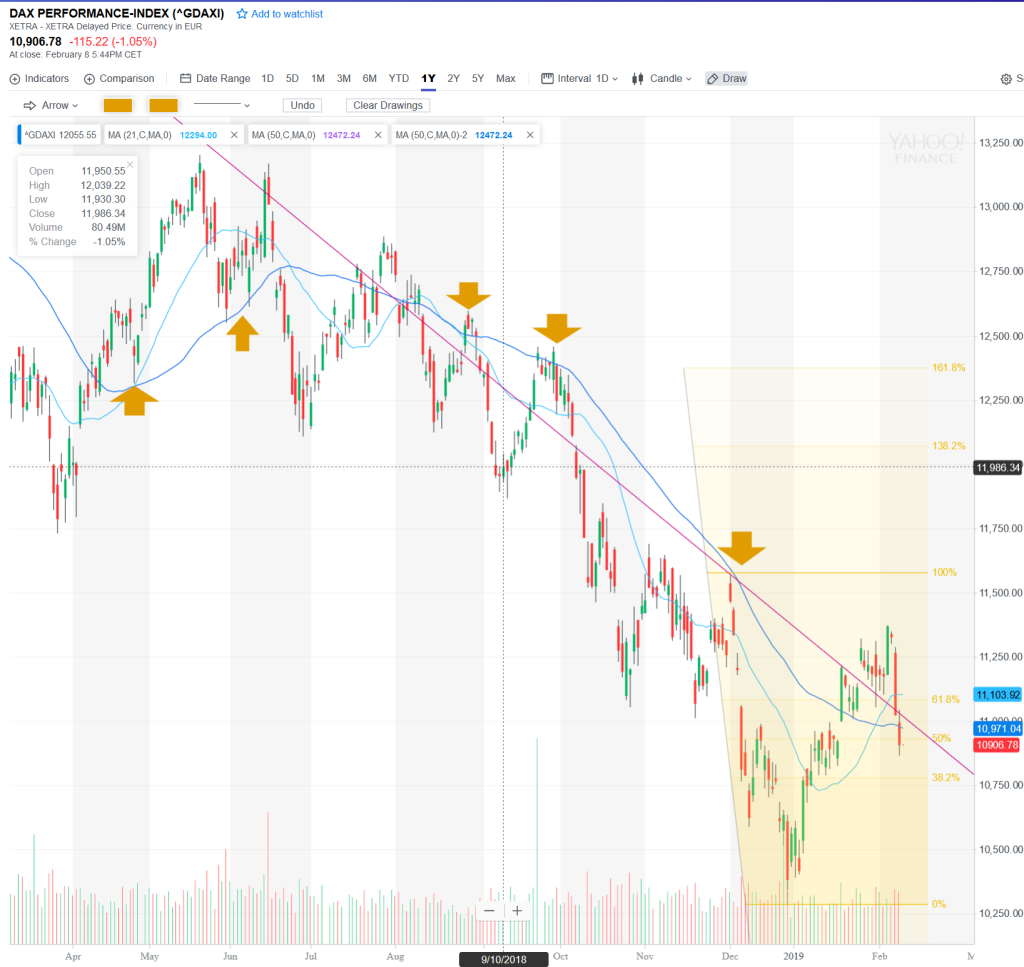
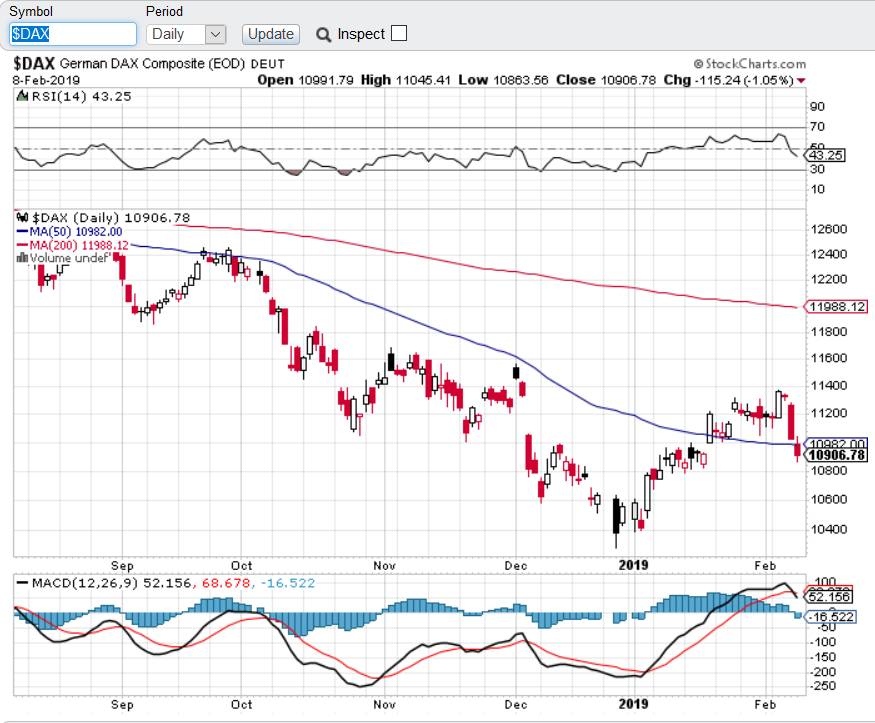
It may seem strange to be looking a 1-, 3- and 6-month daily cash charts to trade on the M1 and M3 charts, but the reason I do this is to find my levels for the day. These long term charts give me essential information about where the MAs and fibs are – i.e. the levels where institutions are buying and selling.

This 1-year chart shows how important it is to know where the 50MA and 21MA are. They often act as magnets for the market and therefore provide me with intraday support and resistance levels.
1-year chart shwoing the possiplities for day trading these levels with 10pt stops for monster trades.
Here’s the Stockcharts 6-month chart showing the importance of 50MA and the high probability of the market reacting to it

Powered by BetterDocs

Using the daily cash chart to trade on the M1
This website uses cookies to improve your experience. By using this website you agree to our Data Protection Policy.
Read more