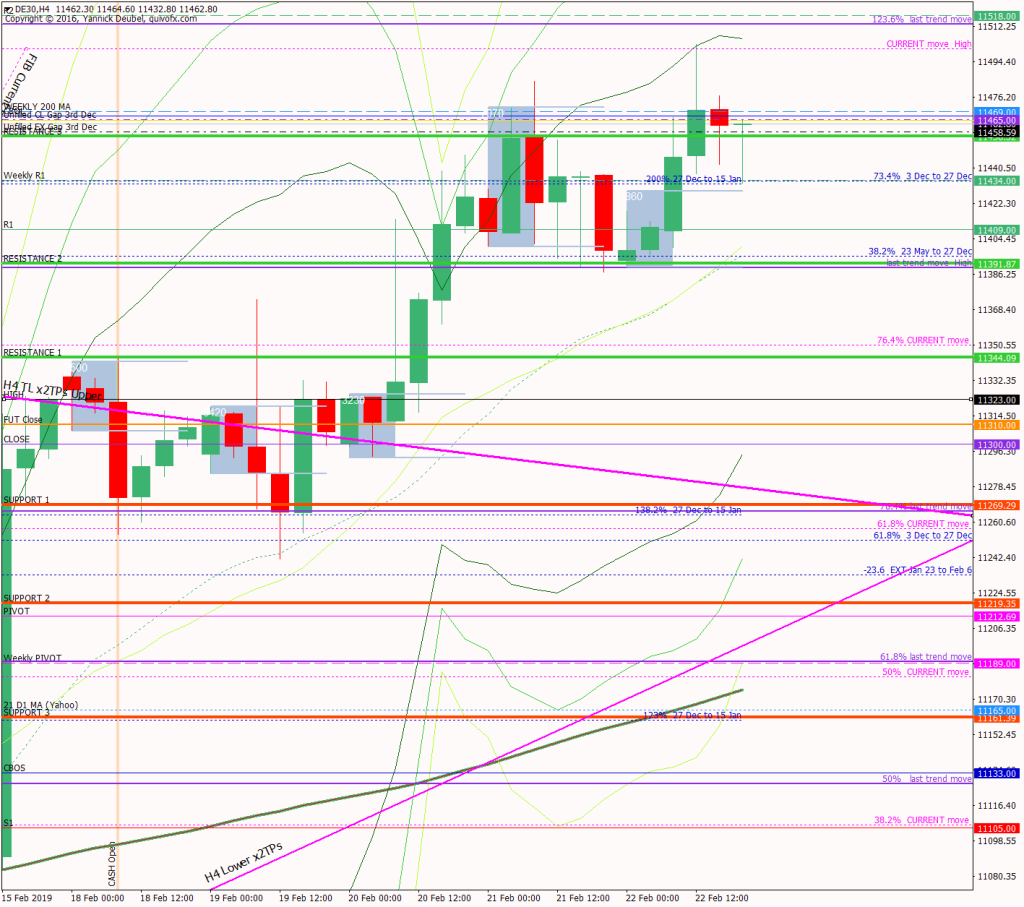
I have been losing recently so I am taking time out to work on my plan and mindset. I traded on Monday 18th and these were the levels and TLs from that day, and what’s interesting is that they applied all week. My RES 2 line was a very accurate support level during the second half of the week and the upper TL was the push-pull level during the first hlaf of the week.
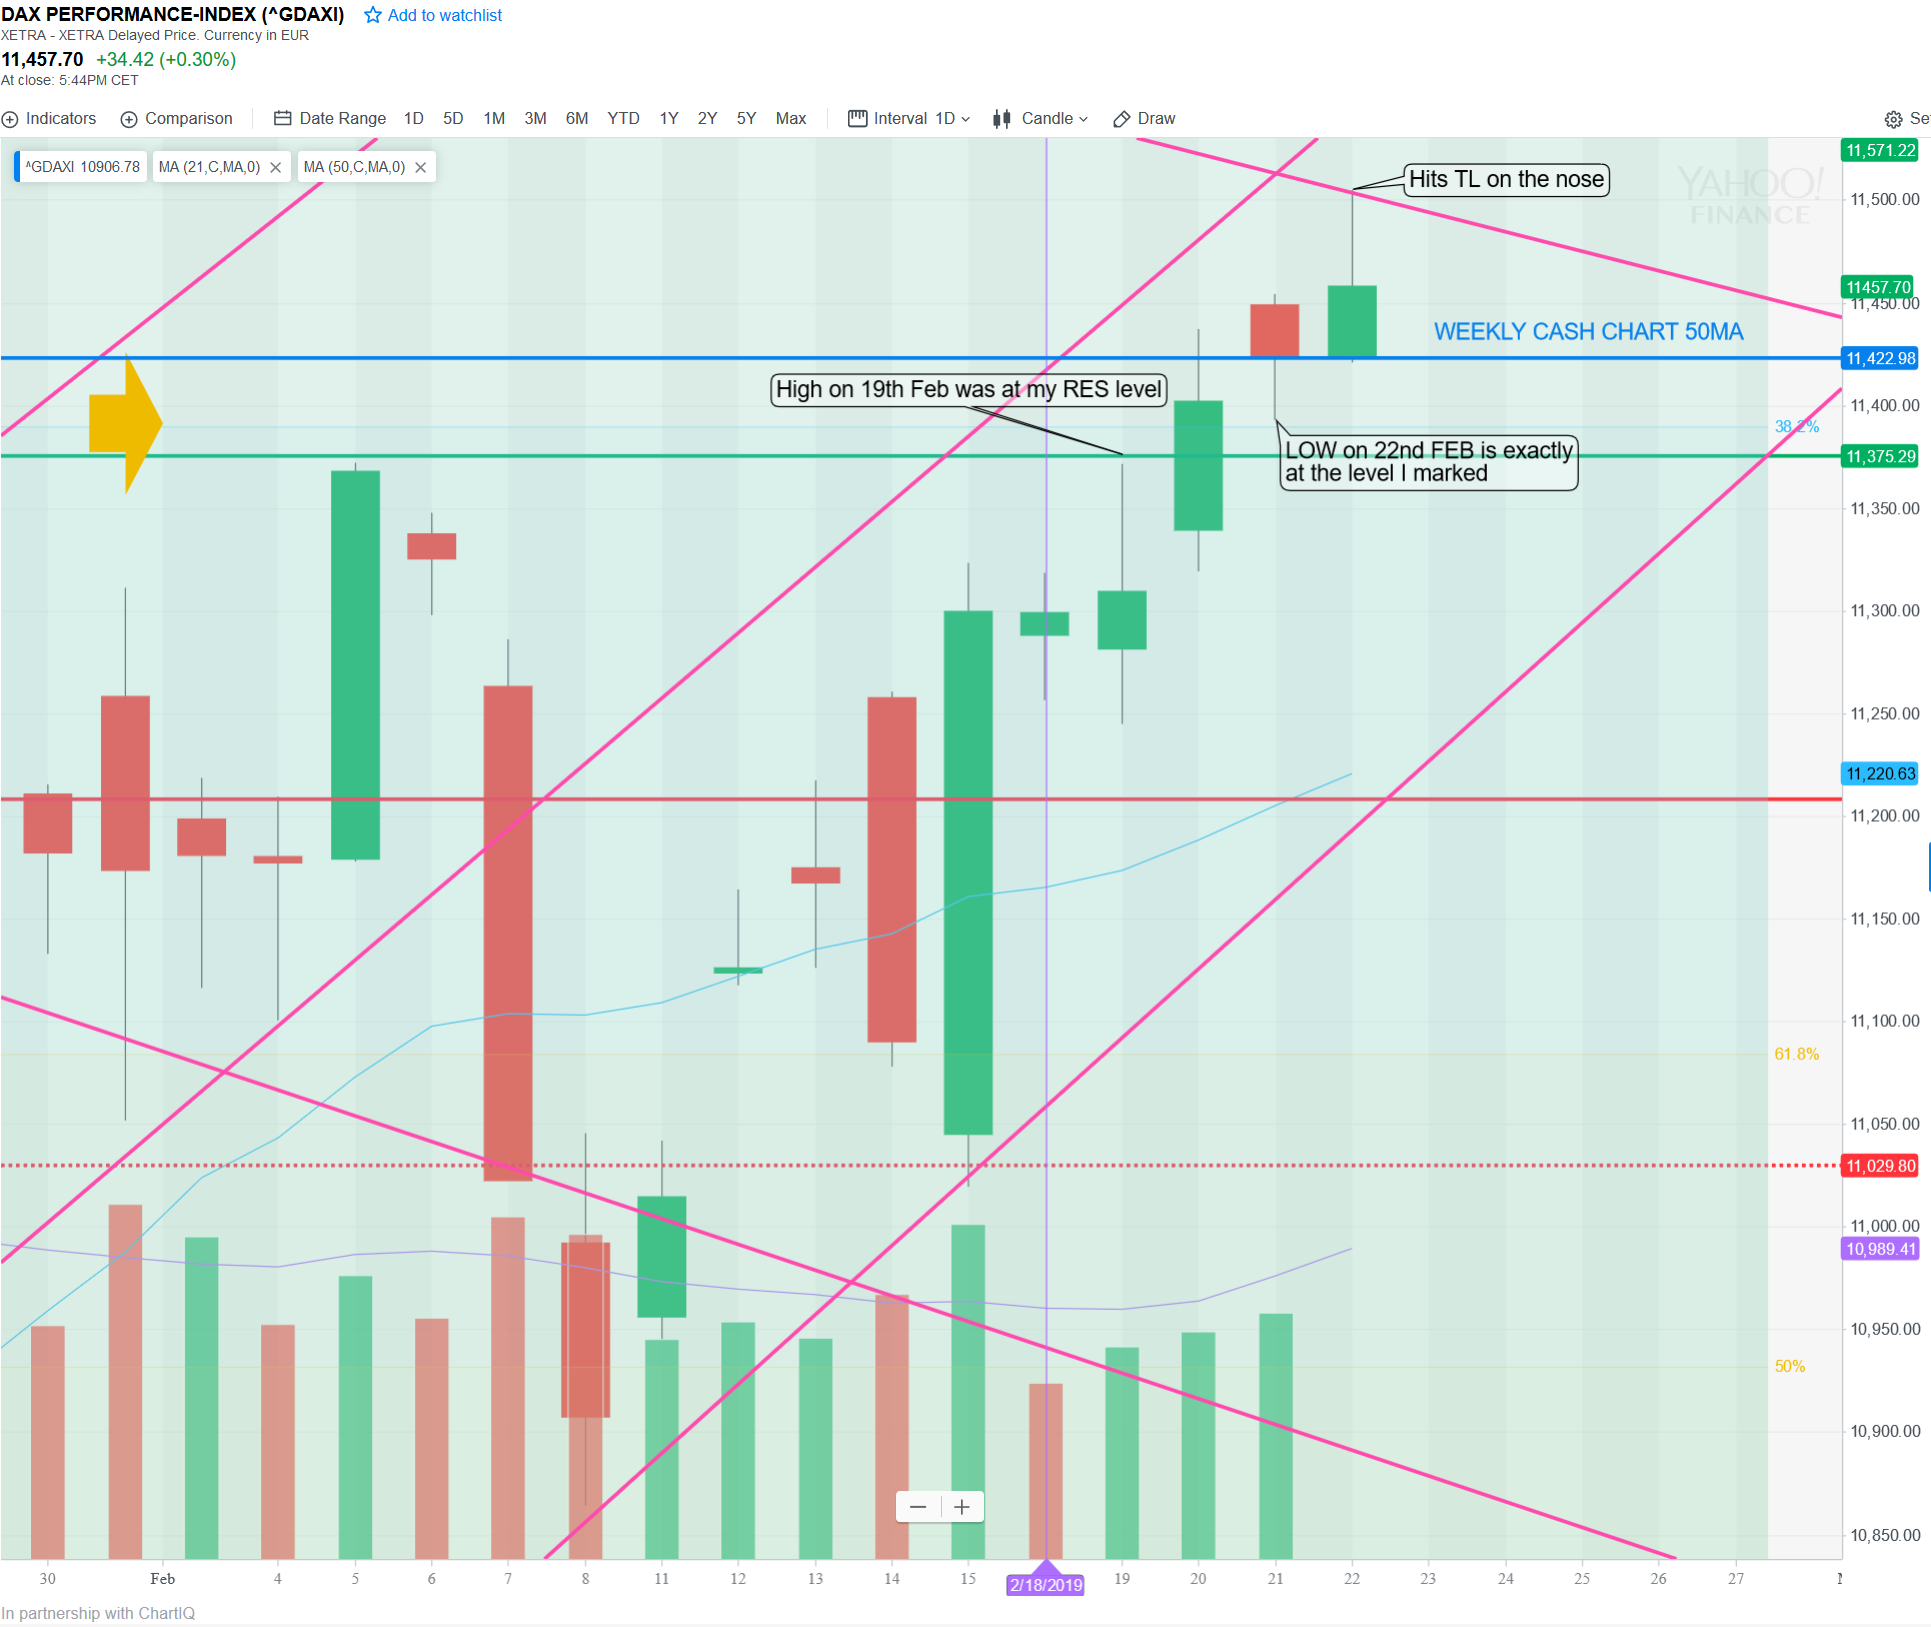
On the daily chart from Yahoo, my upper TL perfectly predicted the high of the week; the high on 19th Feb was exactly at the resistence level I had drawn and the low on 22nd Feb was exactly at he 61.% Fib that I had marked on the chart the previous week.
If I can do this, why the hell aren’t I making any money? Because I am using the same risk (and same account) on trades that use this skill as I am on my ‘experiment’ trades. If I use my 3Min Bolli trade as an approximation of my trading that uses this skill then I am up 20% in 6 months.


