View Categories

Long term analysis with TLs and Fibs

< 1 min read

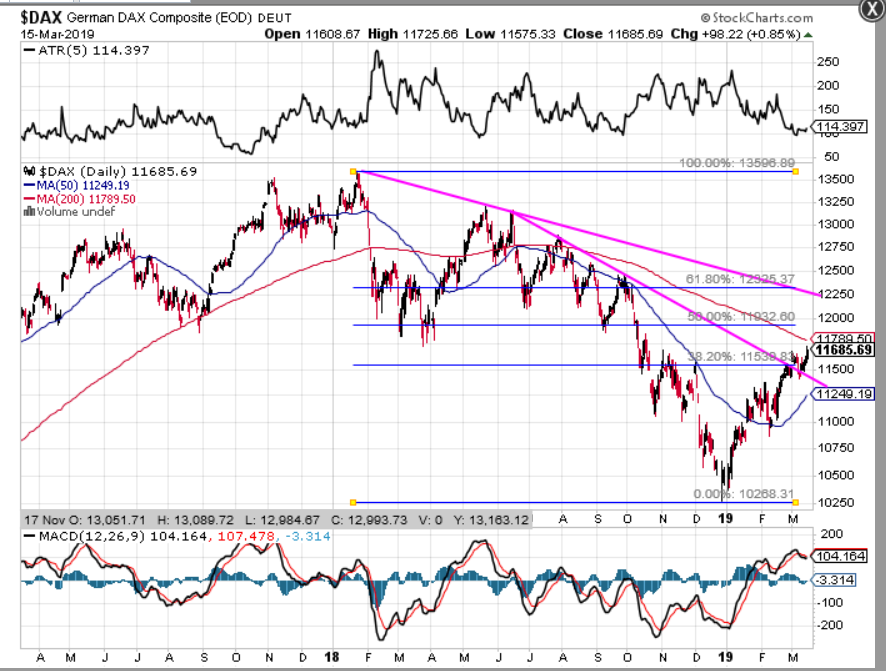
Trendlines, strong support/resistance zones and fibs on long term charts are extremely powerful. Moving averages calculculted from the daily and weekly cash charts also provide highly tradeable KLs on the M1 and M3 charts.

Traditional indicators such as the RSI and MACD using extreme readings and divergences are pretty much useless for the kind of trading I do – and may in fact, be useless for all kinds of trading.
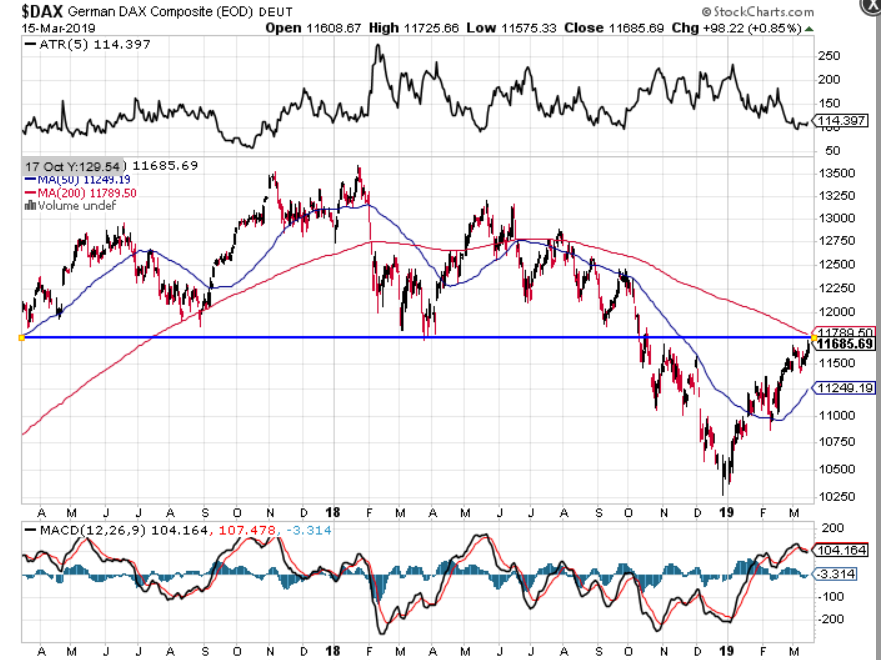
Daily chart showing how the long term support around 11685 combined with 200 (MA) proved irresistabel to the market
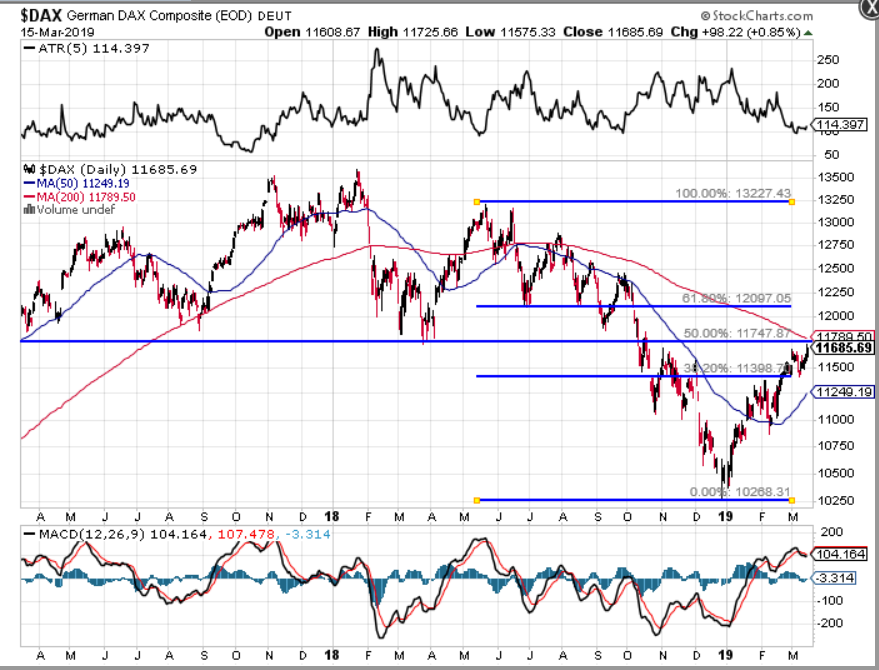
Daily chart showing how the 38.2% fib provided the first significant resistance to the 2019 bounce.
Daily chart showing the use of TLs as an orientation on PA context and significance of moves, i.e. the most recent fast move up find resistance where the 38.2% fib and the TL are in confluence with one another.
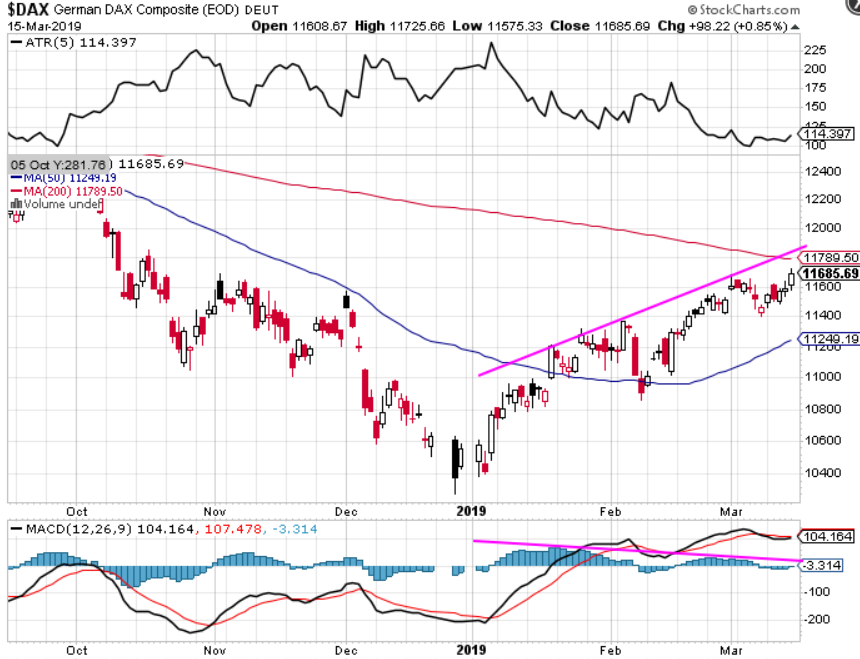
Daily chart showing how a MADC divergence can go on and on and on..

Powered by BetterDocs

Long term analysis with TLs and Fibs
This website uses cookies to improve your experience. By using this website you agree to our Data Protection Policy.
Read more