Content for trading apps, signal services and trading educators.
View Categories
Triangle and 169 how not to trade it
1 min read
Since the 169 fade needs to either
fit the current market flow so that the trade is coherent with the HH-HL or LL-LH sequence
set up so that when price hits the 169 it’s outside the 3Min Bollis
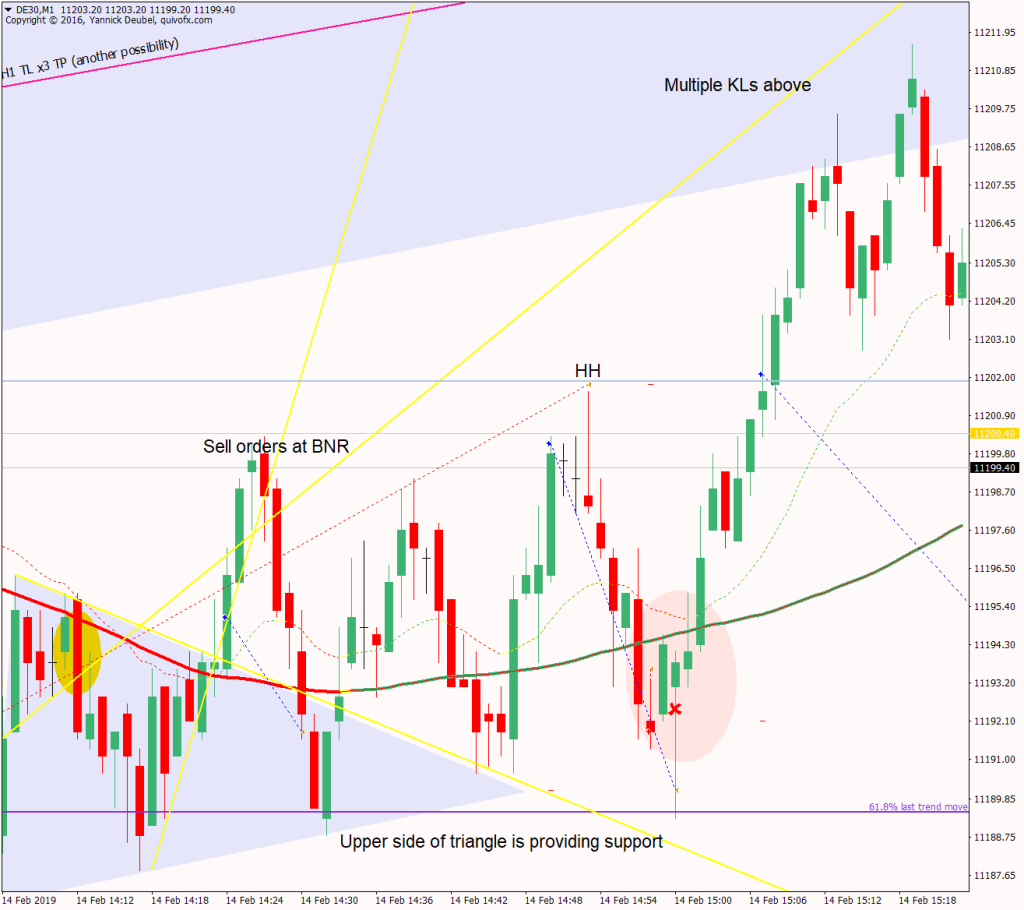
…. the PA below does not fit the criteria for a 169 fade – at best it’s a long with the 169 providing support.
There are two levels of support here – the fib and the 169 and this is conpressing action in 10pt range. This isn’t a good setup, but the only possible trade would be to get value entries – buy at support and sell at resistance so that you are positioned for a break if it does happen.
These trades were experiments in PA reading, and what was aginst all of the was the distortion to the PA casused by the KLs above
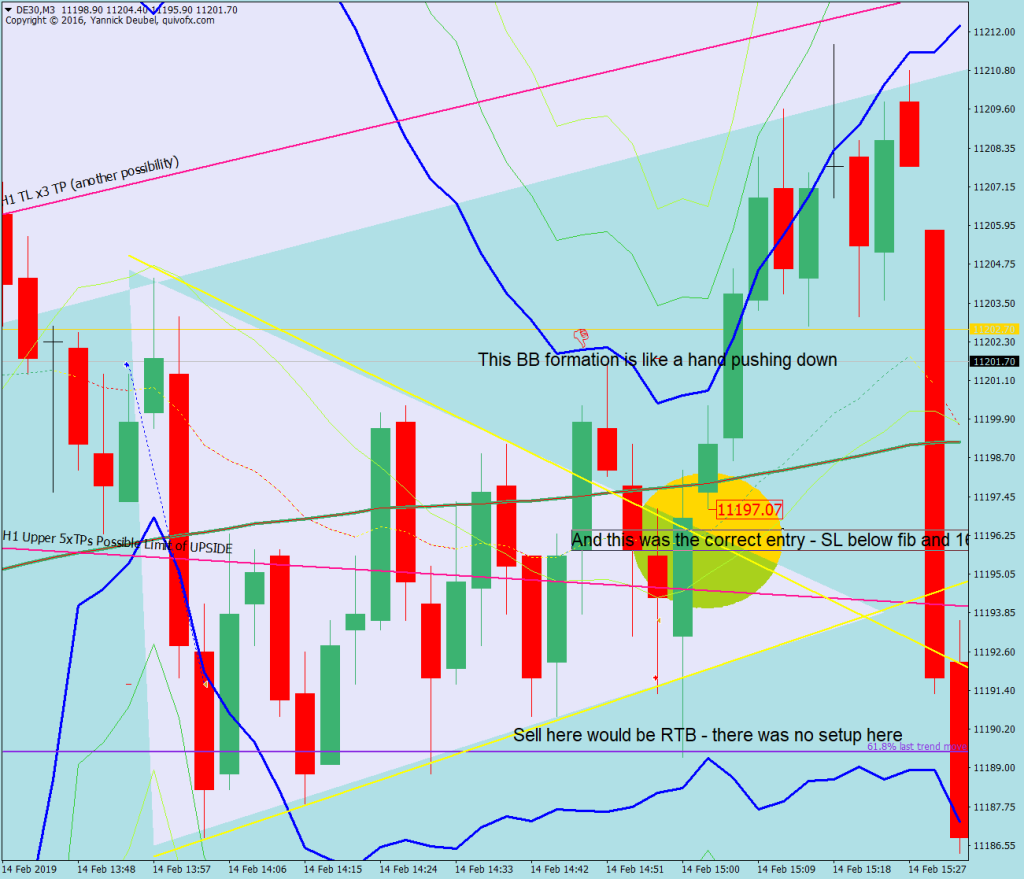
The 3Min chart is much clearer, making the triangle formation much easier to spot. I was looking for a Reverse-Triangle-Break but to the wrong side – the trade setups perfectly on the long side.
The 169 fade baove was actually traded as a break of the triangle which was equally invalid. These needed to be traded as retests – one pop out of the triangle will result in multiple losses. With the fib below, what I really want to see is this pop out of the lower side of the triangle to the fib, a rejection of the fib and then a break of the upper side of the TL – this gives a bvious SL within 10pts of the entry.