View Categories

Video reveals PA was much harder to trade than it appears on a static cahrt

1 min read

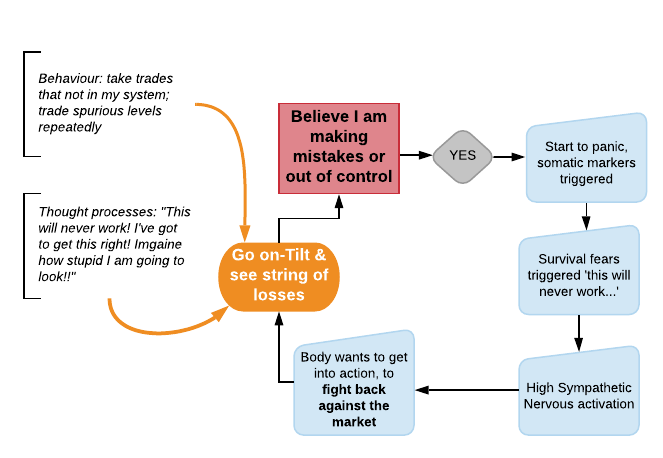
This was such a relief! I thought I was going crazy when I looked at my P&L but the video revealed that my trades were very logical. This is such useful information, as believing I am out of conrol and believing that I have made mistakes leads to …. being out of control and making mistakes.

Once the new HOD is formed above RES 1, all attempt to break upwards are allowed a little room and thne met with sellers before they come anywhere close to a new high

TRADE PLAN: ways to reduce false breakouts on long H-C-Bs
– focus on the formation of the lows rather than the highs
– wait for a new high and then buy a pullback
– watch for the 50% intraday and at the first sign of buying, jump on board
– use some or all of the above but focus on an entry that includes 50% intraday fib within the SL

On the static chart, it looks as though the false first break on the H-C-B was easy to avoid, but the sell bar marked by the green arrow was a big green bar at one point and just broke the TL
Focusing on the formation of the lows is much easier and leads to less impatience and looking at the 50% intraday as the key indicator keeps the picture much clearer

Powered by BetterDocs

Video reveals PA was much harder to trade than it appears on a static cahrt
This website uses cookies to improve your experience. By using this website you agree to our Data Protection Policy.
Read more