These are three Resistance (RES 1 , 2, 3) and Support (SUP 1, 2, 3) lines that I draw on the chart during the futures session. I decide the levels by looking at the following:
- Previous highs, lows and balance points (areas where there was a lot of trade and where the market has spent a lot of time)
- Fibs and fib extensions
- Pivots
- Unfilled closing and extreme gaps.
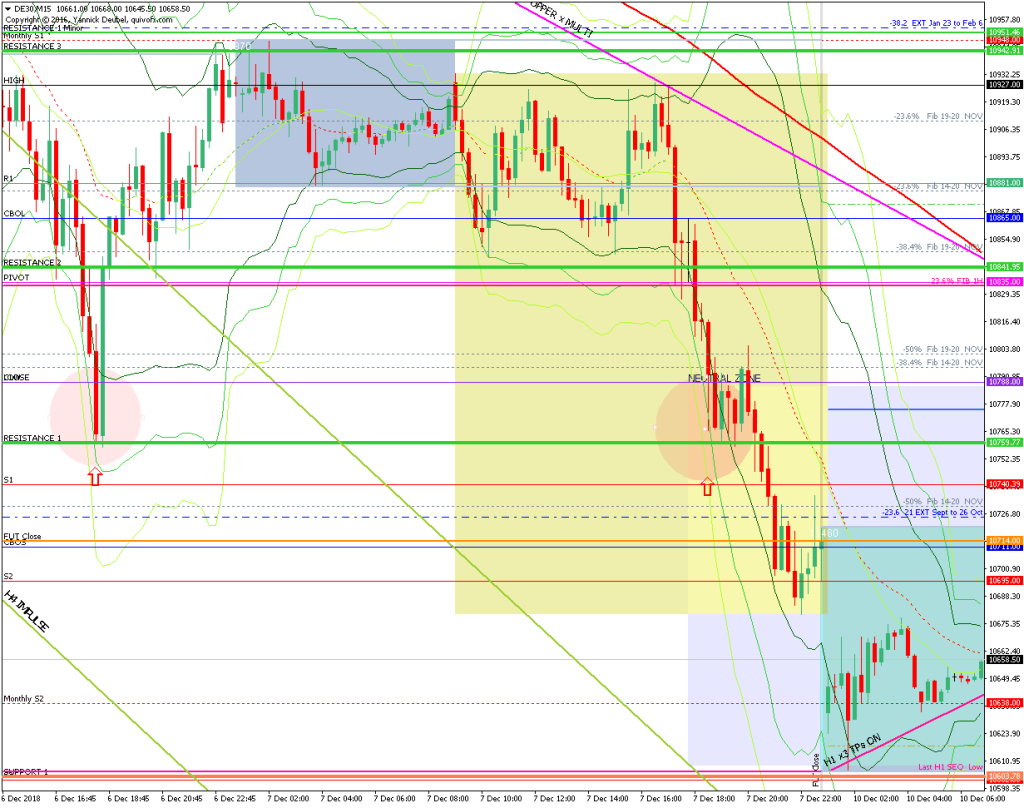
Here’s an example from 10th Dec, showing how I knew where RES 1 was most likley to be.

I use these levels with the 3Min Bolli band system: if price hits the level while outside the 3Min Bolli band, I fade it. If the market has broken a KL and is accelerating, the trade is cancelled.


