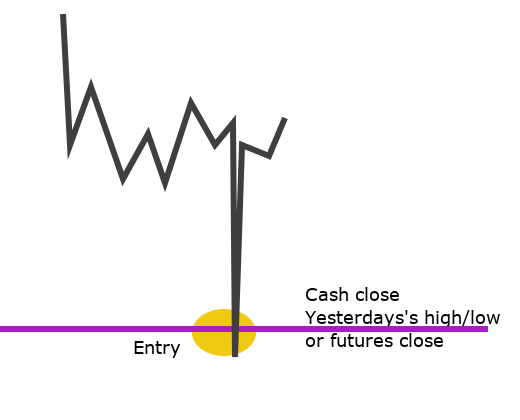
Gap fill fade (Futures, Cash and Ex-gaps)
29 March 2019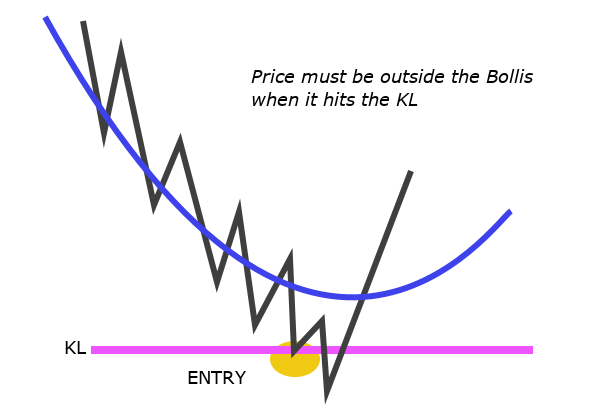
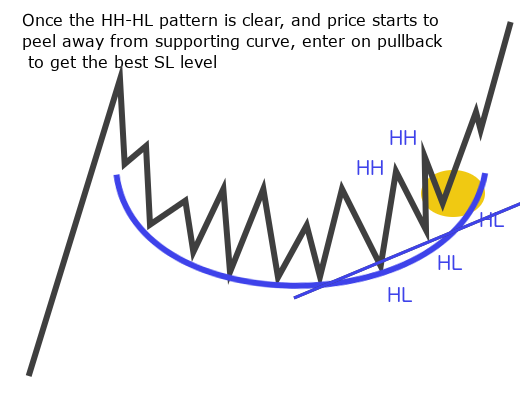
3Min Bolli (reversal off KL)
31 March 2019Summary
This trade sets up when the PA forms a clear triangle. The TLs that form the long edges of the triangle generally need to have 3 or more touch points and the closer the entry to the apex of the triangle the better. The Reverse Broken Triangle (R-B-T) sets up when price makes a false break through one side of the triangle and then breaks out the opposite side.
This trade must be distinguished from a vibration/compression around a level, which is usually a continuation trade.
Entry: a break of the TL that forms either of the long edges of the triangle.
Exit: stop loss is 10pts and the stop is automatically moved to entry at +10pts.
Take profits: this trade does not tend to run, so I take 70% off at 1:1 and the rest at 2:1.
The stats prove this to be wholly wrong – 29% of these trades achieved 5:1, so the TP strategy needed to be adjusted accordingly.
Results
Trading between 9:00 and 11:00 mid-Oct 2018 to end-Feb 2019. From March 2019, these trades are recorded separately from compressions/vibrations at a level, which are included in the stats here.
| Setup | # of Trades | Total PnL EUR (%) R=1% | Average R/winner | Losses # (%) | Reached 1:1, reversed b4 2:1 | Achieved => 2:1 # (%) | Achieved =>5:1 # (%) | Achieved 10:1 +# (%) | Pnl using standard TP strategy | Theoretical PnL vs. Actual PnL |
|---|---|---|---|---|---|---|---|---|---|---|
| Triangles and R-B-Ts | 17 | 9,845 (10.5%) (+10.9R) | 3.88 | 6 (35%) | 4 (23%) | 7 (41%) | 5 (29%) | 2 (12%) | -6+7+(2.5x5) = 13.5R | 2.6R |
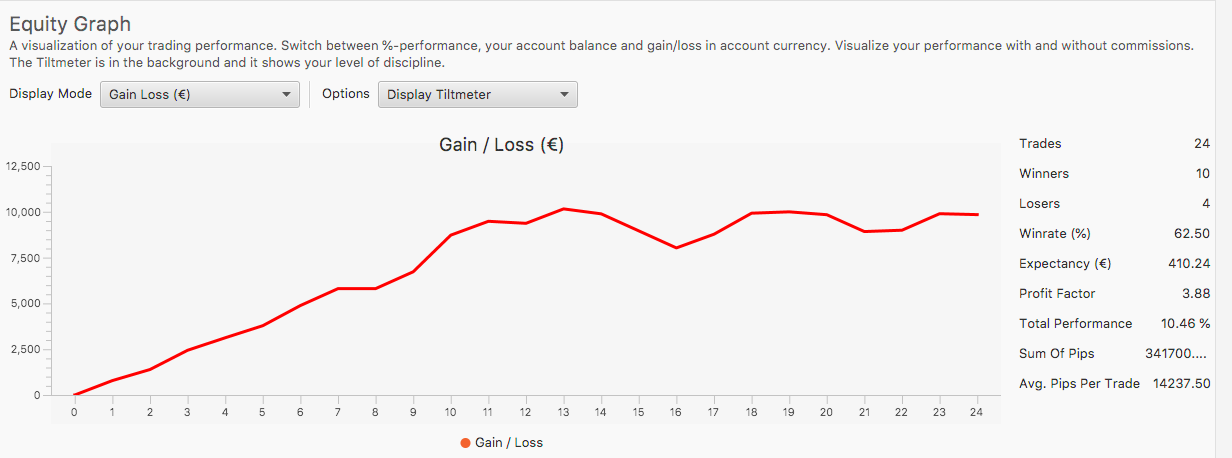
These stats are from Edgewonk. Number of trades is different from the value shown value in the table because Edgewonk counts closed trades, and the figures in the tables represent opened trades.
Why it works
The Dax has a tendency to compress around KLs; the market will hit or exceed a level, then bounce, then do the same thing again, but make a weaker bounce and then again and make a weaker bounce still. This PA creates a triangular PA pattern and creates an excellent trading opportunity. Prices cannot continue to make smaller bounces indefinitely so the market eventually has to decide for one way or the other from (1) this is a valid support or resistance level so instead of making a smaller bounce from the level, the market will make a significant reversal or, (2) this support or resistance cannot hold back sellers or buyers any longer and will break on the next assault.
The Reverse Broken Triangle (R-B-T) pattern works because when the market makes a false break, it effectively gathers firepower for the move in the opposite direction. For example, a false break down will stop longs (sell orders) and tempt in willing sellers and once these players are out of the way, the market is free to move unhindered upwards (and visa-versa for a false break up).
Skills and qualities required
- PA skills to spot KLs and the triangle forming in real time
- patience not to jump on the trade before it has set up
- skill to read the PA context to decide when to use a straight break and when to use a TL retest entry


Filters
PA context that supports the trade
- the trade more likely to work and more likely to run if:
- the triangle forms at a KL with a confluence of levels
- the triangle is clearer i.e. it has at least 3 touch points on the upper and lower sides
- the triangle has taken longer to form
- the trade is into white space
PA context or other factors that cancel the trade
If there are too many levels in front of the trade and levels are generally evenly spaced, the trade is not valid because it will most likely hit the next level and reverse.
- pattern not clear enough – it needs 3+ touch points on each side or a very clear formation at a very clear level
- going into levels
- triangle is within intraday ranging PA context and inside the 3Min Bolli Bands
Open issues
- straight break or retest entry?
- how important are KLs?
- will the Edgewonk reversal flag be enough to record R-B-Ts
- is this a continuation trade or a trade to use during corrective PA as long as the levels are good?
- See stats: these trades run and TP strategy must be changed to the standard, plus on contract left for 10x (test)