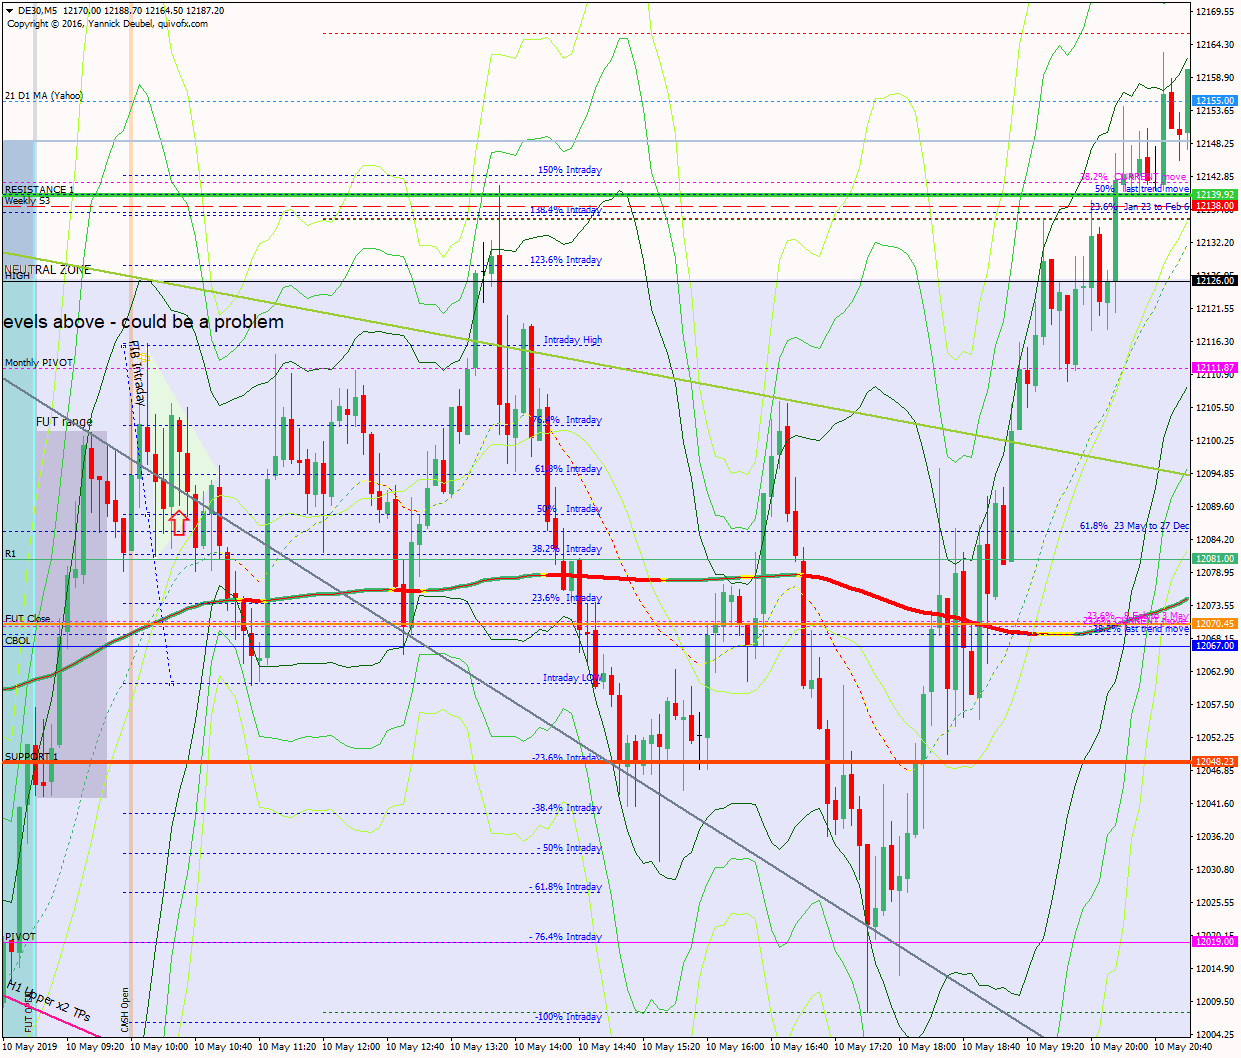
10 May: Broad, ranging action above CBOL to close higher
10 May 2019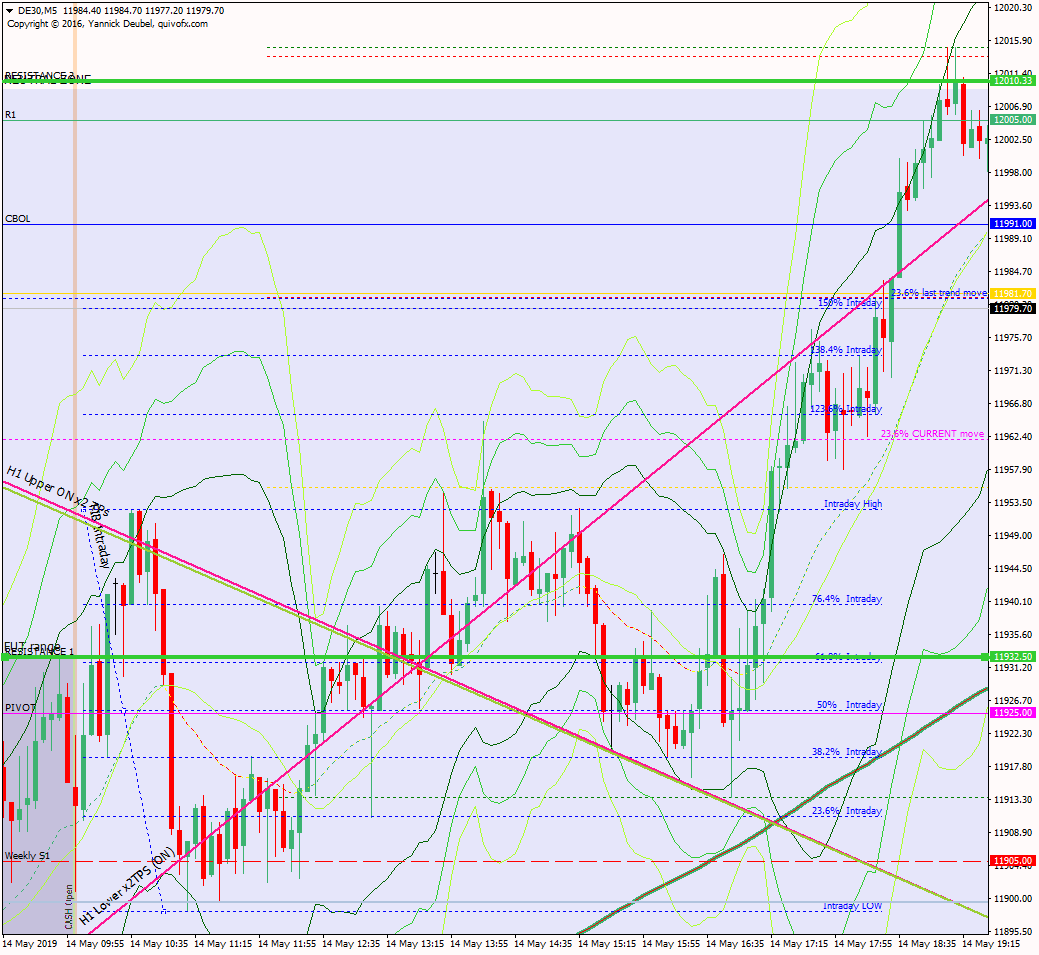
14 May: Wkly S1 provides early support then price breaks up through downward channel
14 May 2019Pre-open scenarios
Friday was a positive session on the cash market and even more positive in the US session with lots of buying into the close. ON, the market has given back the US session gains and the futures open was 301pts above the cash close. The market is now sitting on the TL that is supporting the move up and it has returned to the upper edge of the channel that contained the first move down – having broken out of it on Thursday evening and Friday to form the corrective phase. So today the market could move up to CBOL area and then form a new downward channel above the original one. Even if it gets to the 21MA at 12159, it would still be considered corrective – above there we have the 50% retrace of the move and the futures close. On the downside, if the corrective TL breaks early on, this could inspire another day of trending PA towards the cash chart 50MA at 11842.


Futures opened at 12091, leaving a gap of +31pts against the cash close and -94 against the futures close. The futures open was within yesterday’s range so there are no ex-gaps.
Physical/body
Sleep – what time did I go to bed? 23:00 so 7.75hrs but woke up multiples times during the night.
How much coffee have I had? Half a medium pot.
How do I feel? Excited about the markets and me new procedures but tired and afraid.
H4 and H1 charts from the morning futures session


Time stamp: 8:40
Scenario 1: market sees a fast bounce off the cash gap close but then falls through the supporting TL and then trends down to 11956 and beyond – no buying power at the gap and it made it all the way to the cash daily chart 50MAScenario 2: early strength and then ranges up to 12141, with a significant pullback at 12111, then continues to range between 12132 and 12027Scenario 3: fills the cash gap early on and then trends up to R2/50%fib/fut close around 12170-90 and reverses there
What the market looked like at the end of the session

PA during my trading hours

Key points about today's PA and setups that worked
Broke TL supporting the corrective move and continued down all day
- the gap – which was confluence with the H TL and my SUP 1 level – filled in the first minute and saw a 10pt bounce
- after that, the market fell through support and lost 50pts in less than 15bars
- the low provided support for the first bounce, which got as far as a retest of the SUP 1 level
- from there the market fell to S2 during my session, with shallow pullbacks at each of the pivots
- at S2, the Imp/Corr structure began to fail, indicating that a larger bounce was underway
- price got back up to CBOS and then ranged between there and SUP 3 for the rest of the morning
- having formed LHs above the level and in line with the overall trend and the move into the compression, the market broke downwards
- it reached S3 with hardly a pause and then worked its way down to the critical cash chart 50MA at 11842
How effective was my Neutral Zone? This didn’t make much sense today as the market saw trending action within it and didn’t react much when it broke – a better lower boundary was around SUP 2 or the low
How precise were my levels? The break of SUP 1 inspired large declines; SUP 2 was a range and the market stair-stepped down through it with pullbacks at the low, S1 and CBOS; SUP 3 was the low of this sequence but the cash chart level below was much more important
What I did

TOTAL = 7.3R | # Trades 9 | Winners 3 | BE 2
Average R per winner = 3.8 | Losses > 1R = 0 | Scratched = 0
R-multiples: trades 2:1 or more = 3 | trades 5:1or more = 3
Outcome using standard TP strategy and same trades
2:1 trades (3R) + 5:1 trades (3 x 2.5R) + BE (0R) + Losses (-4R) = 6.5R
My results vs. SYS = +0.8R
ON TILT trades = 2 (-2R)
Average coherence 2.5
Today's most gorgeous setup
Short description

For reference: 6 month cash chart at COB yesterday

Pre-open scenarios
Summary with scenarios
Futures opened at xxx, leaving a gap of +xxpts against the cash close and xx against the futures close. The futures open was within yesterday’s range so there are no ex-gaps. The fututresopen created an ex-gap ..
Physical/body
Sleep – what time did I go to bed?
How much coffee have I had?
How do I feel?
H4 and H1 charts from the morning futures session
Time stamp:
Scenario 1:
Scenario 2:
Scenario 3:
What the market looked like at the end of the session
PA during my trading hours
Key points about today's PA and setups that worked
One sentense
-
bullets
How effective was my Neutral Zone?
How precise were my levels?
What I did
TOTAL = x.xR | # Trades x | Winners x | BE x
Average R per winner = x.x | Losses > 1R = x | Scratched = x
R-multiples: trades 2:1 or more = x | trades 5:1or more = x
Outcome using standard TP strategy and same trades
2:1 trades (?R) + 5:1 trades (? x 2.5R) + BE (0R) + Losses (-?R) = xR
My results vs. SYS = xR
ON TILT trades = x (x.xR)
Rule of 3 trades = x (x.xR)
Scratched trades = x (variance vs. rules = x.xR)
Today's most gorgeous setup
I already had in mind that if the market didn’t see much buying from the gap close, then it was aweak and this was definitely the case. There was a 10pts bounce off the SUP 1 and TL level and this PA created a H-C-Bsetup which was a 20R trade.

For reference: 6 month cash chart at COB yesterday


