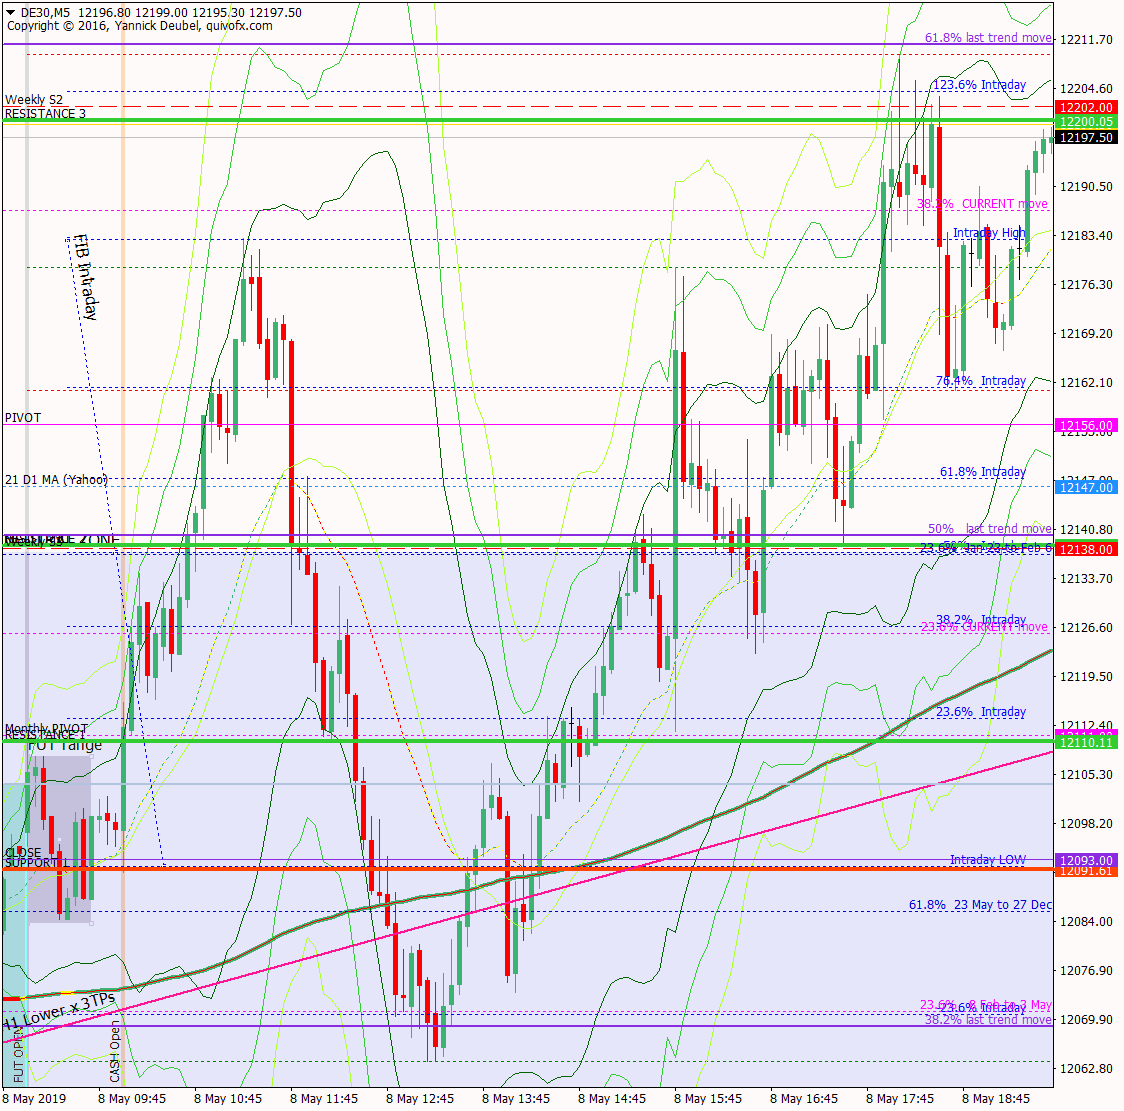
8 May – Early strength, fills futures gap and then sees 12200
8 May 2019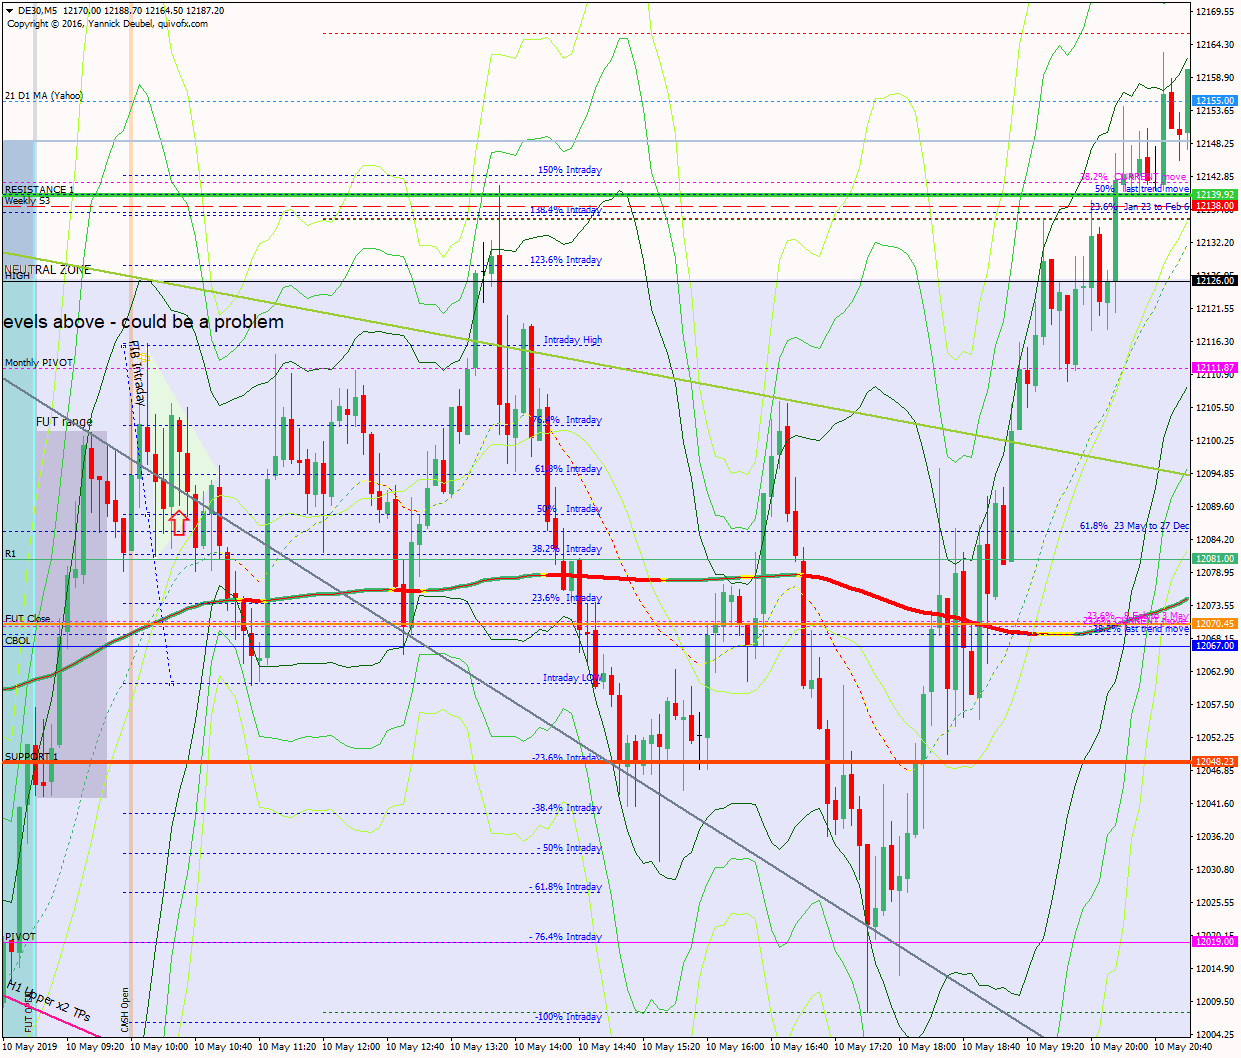
10 May: Broad, ranging action above CBOL to close higher
10 May 2019Pre-open scenarios
Futures have opened lower after ON falls, contradicting a robust US session. The market is now at the TL that has supported the corrective move this far; if this break decisively, there could be fast falls to new lows. At this point, the TL is intersecting with 3 critical fib levels: the 23.6% of current move, 50% of the most recent trend up and 23.6% of the 23 Jan to Feb 6 move. So this is really the make-or-break level today. If it bounces off, it will still be considered a corrective move until it gets above 12250, although any move beyond yesterday’s highs will look pretty positive.


Futures opened at 12142, leaving a gap of -53pts against the cash close and -38 against the futures close. The futures open was within yesterday’s range so there are no ex-gaps.
Physical/body
Sleep – what time did I go to bed? 23:30 so 7.25 hrs
How much coffee have I had? Half a medium pot
How do I feel? A little tired and few crappy stories have been going through my mind
H4 and H1 charts from the morning futures session


Timestamp: 8:30
Scenario 1: corrective supporting TL breaks and stays broken and we see waterfall declines down to at least the previous lows 12027 and perhaps even as far as the 50MA at 11822 – this one is closest but my low was incorrect
Scenario 2: supporting TL sees one or more false breaks to form an HL around 12100 and then the market ranges all day to form a high around 12200
Scenario 3: price vibrates around supporting TL making several breaks and retests and then makes up its mind later in the day; if it is collecting firepower with this move, then we will see highs around or above 12250 and if it is exhausting buyers, the latter part of the session will see large declines to the levels mentioned above.
these were along the right lines but they were out of date by the time the market opened
What the market looked like at the end of the session

PA during my trading hours

Key points about today's PA and setups that worked
The supporting TL did break and stayed broken – but in the futures session.
- after seeing the negative signal of the TL broken, the market made an immediate move down to CBOS-S1-SUP 1 at the open, overshot the levels and then rebounded to monthly pivot which it also overshot
- on the second touch of SUP 1, price went straight through it and then down to y’day low
- from there it made a volatile move back up to 12106, an LH against earlier in the session and then dropped again
- this PA – with the new lows being bought and highs being sold – was ranging PA below a broken level, so during the morning session, there was still a possibility that the market would reject the break and reverse during the afternoon
- the market then formed LHs around SUP 1 and extended below y’day low although this move was also rejected and HLs also formed
- given the broken TL and action being most below CBOS, with the market finding few buyers above it, this set the tone for lower
- the triangle that formed during the morning session eventually gave way and the market dropped to new lows
How effective was my Neutral Zone? The lower edge of my Neutral Zone was in as a good a position as it could have been given the spread out levels today; even though it was breached by more than 10pts, each break was swiftly rejected and the third and final attempt at the level hit it on the nose and then dramatically fell away – this would have been either a retest trade, a trainglebreak or both.
How precise were my levels? SUP 1 really needed to be a range between CBOS and S1 but it gave a successful 3Min Bolli anyway; SUP 2 saw a brief vibration around it and set up as an Imp-Corr trade but failed as 3Min Bolli.
What I did

TOTAL = 3R | # Trades 5 | Winners 3 | BE 1
Average R per winner = 1.3 | Losses > 1R = 0 | Scratched = 0
R-multiples: trades 2:1 or more = 3 | trades 5:1or more = 0
Outcome using standard TP strategy and same trades
2:1 trades (3R) + 5:1 trades (0 x 2.5R) + BE (0R) + Losses (-1R) = 2R
My results vs. SYS = xR
ON TILT trades = 0 (0R)
Rule of 3 trades = 1 (1.8R)
Scratched trades = 0 (variance vs. rules = 0R)
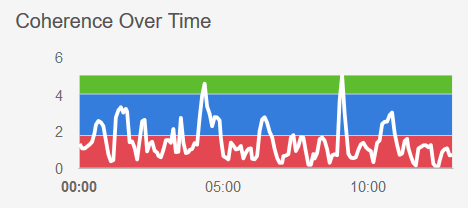
Average coherence 1.4
Today's most gorgeous setup
This was an entry for the trending that I thought could happen if the TL broke and stayed broken which it did during the futures session. The best entry would have been the monthloy pivot as that was the HOD, whereas my entry just got pipped on BE after reaching 4:1. This trade is best classified as an Imp-Corr rather than the H-C-B. What this PA tells me is that there is always a way in – however much it appears that the train has left the station!!

For reference: 6 month cash chart at COB yesterday


